Dashboard Overview - Dialer Dashboard Report
The Dialer Dashboard is a real-time view of dialing activity across all active projects. It is accessible through the MAXWell Portal via the PhoneOps Dashboard option in the left-side navigation menu.
The dashboard refreshes automatically every 15 seconds and is active between 9:00 AM and 2:00 AM daily, covering the full span of dialing operations.
Dashboard Layout
The dashboard is organized into two main sections:
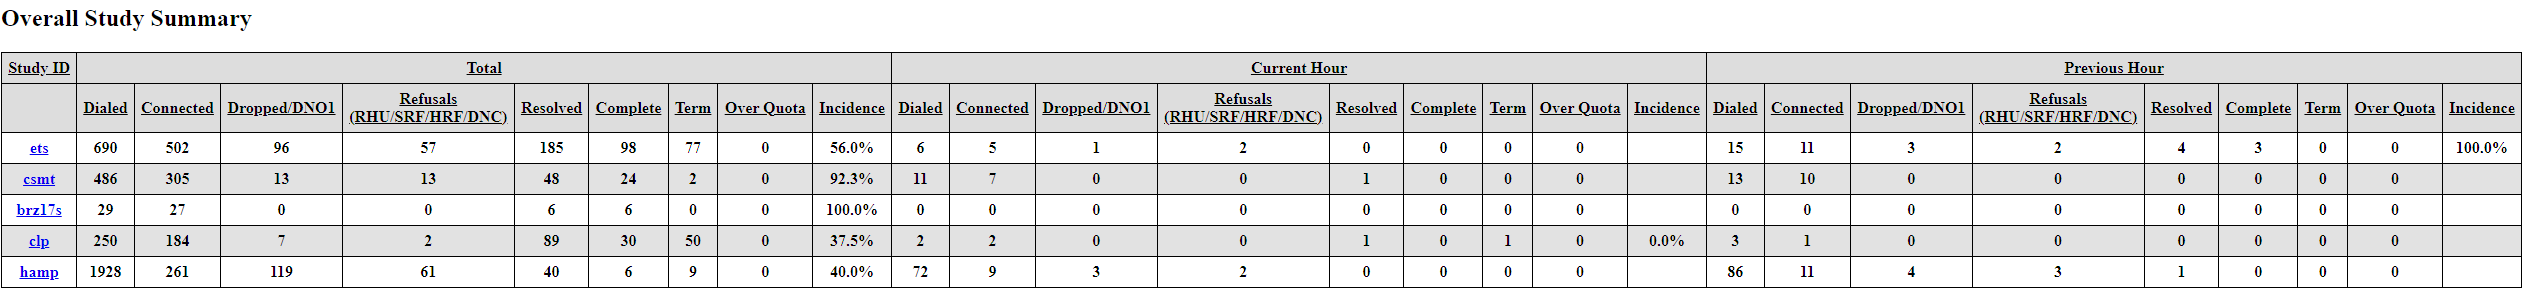
Overall Study Summary
The top section displays a single rolled-up row per project, combining the activity of all agents currently working that project into one summary line. This gives ops staff and PDs a quick at-a-glance view of how each project is performing across the floor without having to dig into individual agent detail.
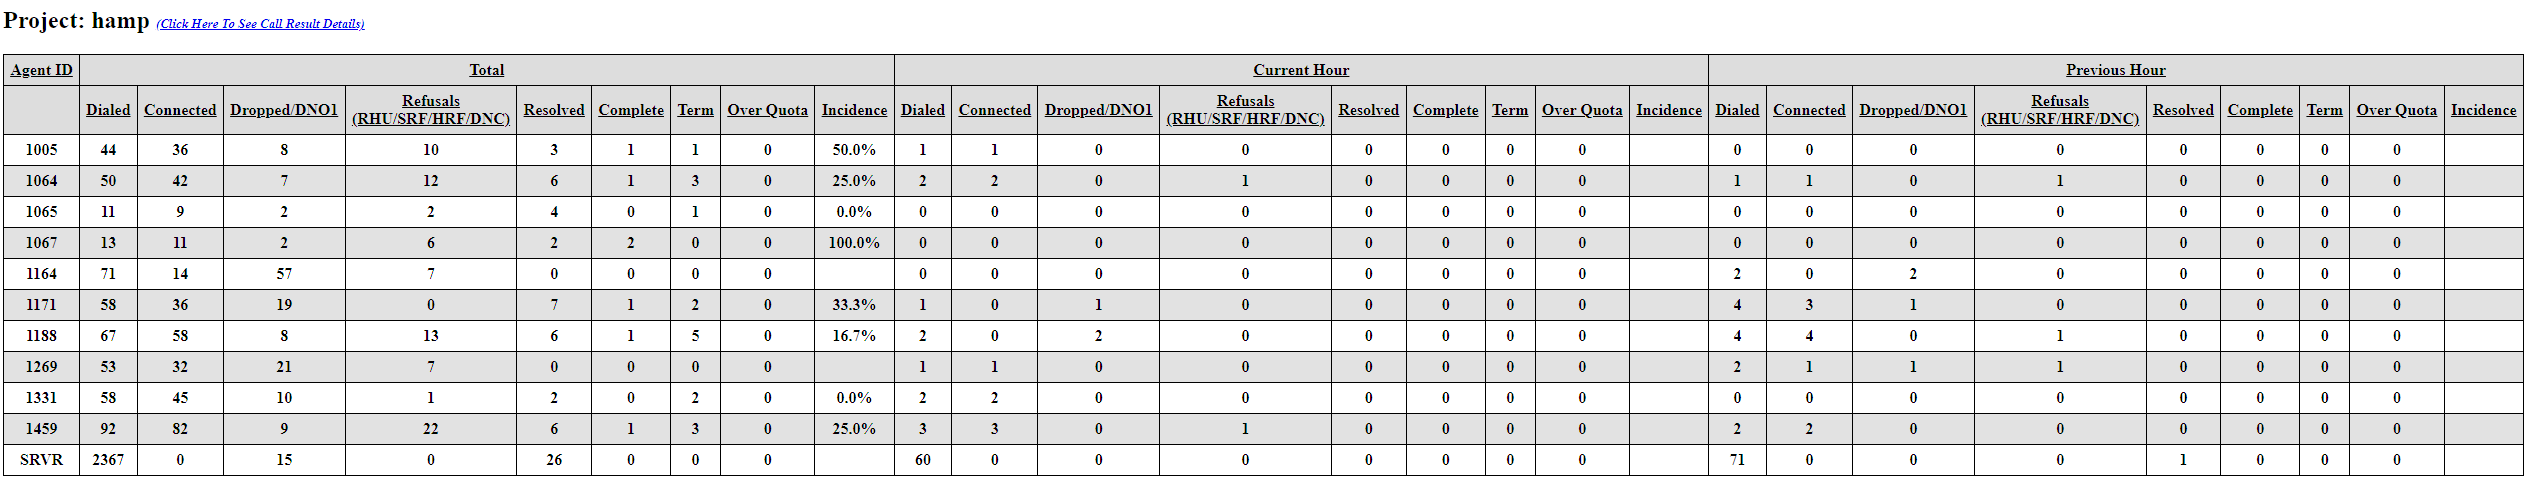
Per-Project Breakdown
Below the summary, each project is displayed individually with its own table. Each table lists one row per agent currently working that project, identified by their numeric Agent ID in the leftmost column. At the bottom of each table is a row labeled SRVR, which represents calls that were dispositioned automatically by the dialer before ever reaching an agent -- interviewers do not see these calls.
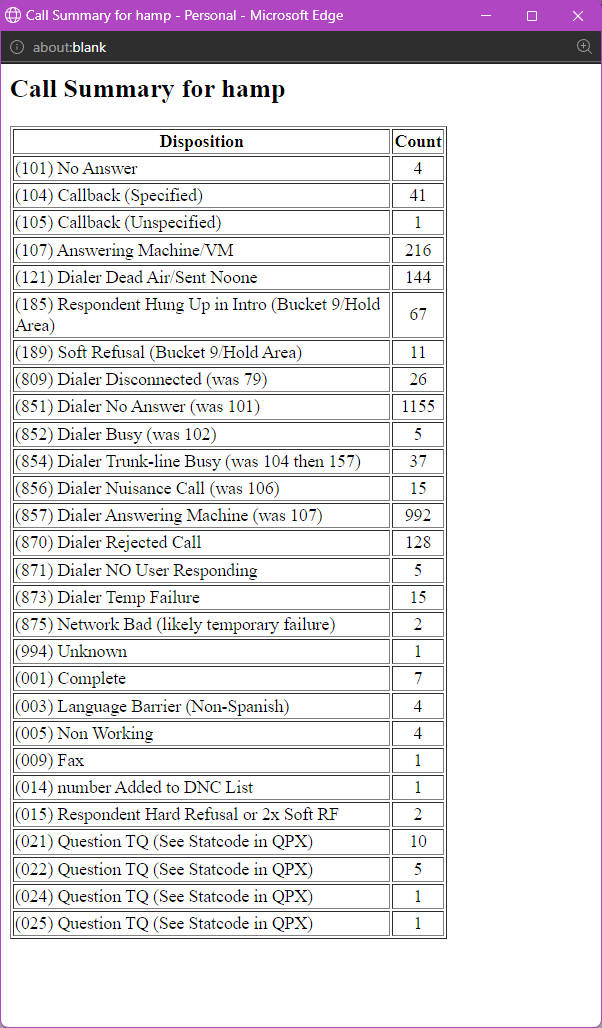
Call Results Details
Next to each project name in the per-project breakdown is a "Click here to see Call Results Details" link. Clicking it opens a small pop-up window listing every call result code recorded for that project since the start of the current day, along with its count.
This is particularly useful when the Resolved column shows a high number -- the pop-up lets you quickly see which specific resolved codes are driving that count (for example, a spike in disconnected numbers, wrong numbers, or fax tones) without having to pull a separate report.
Column Sets
Every row -- whether in the summary or the per-project breakdown -- displays three sets of columns: Total, Current Hour, and Last Hour. All three sets share the same column definitions, described below.
Column Definitions
The following columns appear under each of the three time-period sets.
Dialed
The total number of phone numbers attempted by the dialer or agents in 1:1 mode, regardless of how the call ended. Any number the system touched counts here.
Connected
The number of calls where a connection was established and the call was passed to an agent or interviewer to handle. A connected call means a live respondent (or answering machine) was reached and handed off.
Dropped / DNO1
A combined count of two related non-productive outcomes:
- Dropped -- calls where the dialer hung up before reaching 4 rings (dialer-initiated drop).
- DNO1 (Dialer Sent No One) -- calls where the respondent answered but hung up before the call could be connected to an available agent/interviewer. *These are a gray area, and could be confused with Respondent Hung Up During Intro
Refusals
A combined count of respondents who declined participation, covering four specific disposition codes:
- RHU -- Respondent Hung Up during the introduction or screener text. *These are a gray area, and could be confused with Dialer Sent No One
- SRF -- Soft Refusal (respondent declined but may be re-contacted).
- HRF -- Hard Refusal (respondent declined and should not be re-contacted).
- DNC -- Do Not Call (respondent requested to be added to the internal DNS/suppression list).
Resolved
The total count of numbers that have reached a final, non-productive outcome -- meaning the number is effectively dead and will not be redialed. This includes any disposition where no further contact attempt would be made, such as: Completes, Terms, Over Quotas, disconnected numbers, language barriers, fax/computer tones, wrong numbers, and similar unworkable results.
Complete
The number of interviews that were fully completed by a respondent who qualified and finished the entire survey.
Terms
Respondents who were screened out (terminated) during the interview because they did not qualify for the study based on the screener criteria.
Over Quota (OQ)
Respondents who qualified and would have completed the interview, but were terminated because the quota cell they fell into was already full at the time of their call.
Incidence
A calculated percentage representing the rate at which willing respondents qualify and complete the survey. The formula is:
Incidence = Completes / (Completes + Terms + Over Quotas)
A higher incidence percentage means a larger share of respondents who engage with the survey are making it through to a complete. A lower incidence typically indicates heavy screening requirements or a difficult-to-reach target population.
Usage Notes
- This dashboard is intended for monitoring active dialing sessions. It is not a replacement for end-of-day or end-of-project reporting.
- Because the data refreshes every 15 seconds, numbers will shift during active calling hours -- especially in the Current Hour columns.
- The Last Hour columns provide a stable recent snapshot and can be useful for spotting trends or sudden changes in call patterns.
- If a project does not appear on the dashboard, confirm with programming staff that the project is actively loaded and dialing.