Dashboard Overview - Production Report
Realtime Production Report
The Realtime Production Report is the primary supervisory tool for monitoring project and interviewer performance during an active calling shift. It is the digital equivalent of walking the floor every hour to check on each interviewer's production -- except it updates automatically every 5 minutes.
The report runs daily from 9:00 AM to 2:00 AM and auto-refreshes every 310 seconds (5 minutes plus a 10-second buffer to allow for compile time) from the moment the page is first loaded.
This report is available to all Portal users.
Accessing the Report
The Realtime Production Report can be accessed two ways:
- Directly via browser URL
- Through the MAXWell Portal dashboard link
Page Layout Overview
The report is organized into two levels: an Overall Summary at the top of the page, followed by individual Per-Project Tables for each active study.
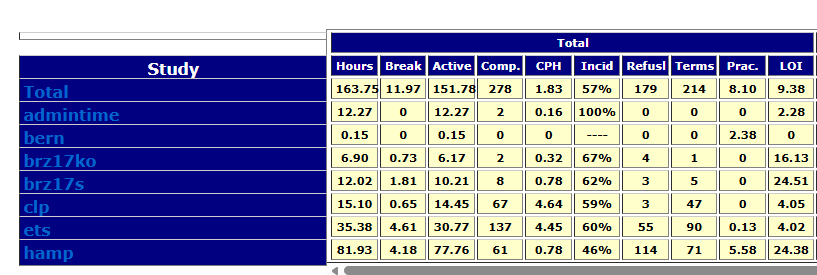
Overall Summary Table
The top table displays a rolled-up view of all active projects combined, with one row per study plus a grand Total row. This gives supervisors an at-a-glance picture of how the entire shift is performing.
The Overall Summary shows every hour of the day across its hourly columns -- one column group per hour, from the start of the shift through the current time.
Clicking on a Project's name will jump you down to that project's agent specific table.
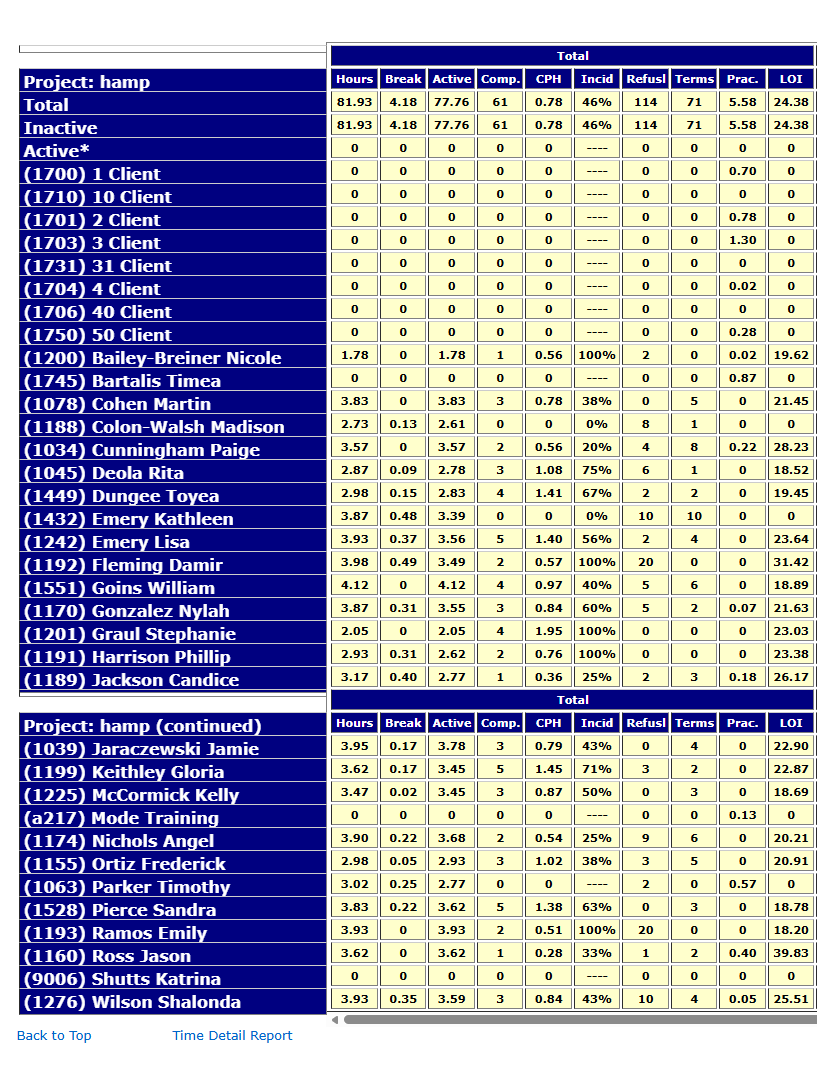
Per-Project Tables
Below the summary, each active project has its own table. These tables break down production to the individual interviewer level.
Within each project table, there are three category rows before the individual agent listings:
- Total -- Combined stats for all agents on the project (active and inactive)
- Active* -- Agents currently connected to this project
- Inactive -- Agents who have either switched to a different project or ended their shift for the day
Individual agent rows follow, sorted alphabetically by last name (displayed as Last, First). Each agent row is prefixed with the station number they logged into, enclosed in parentheses -- for example: (1116*) Reyes Andrew.
An asterisk (*) next to the station number indicates the agent is currently connected to the project.
On larger projects, the column header row will repeat after every 15th agent to make scrolling through long tables easier.
Project tables remain on the page for the full shift even after all agents on that project go inactive. The table will stop adding hourly columns at the last hour the project saw activity.
Column Definitions
Each table contains a Total column group (cumulative for the full day) followed by individual hourly column groups -- one per hour the project was active. Both the Total and hourly groups share the same columns, with one exception noted below.
Hourly columns are arranged with the most recent hour on the left, scrolling right into earlier hours. This ensures the most current data is always visible when the page loads without scrolling.
Cells displaying ---- indicate there is no data available to calculate that value for that period.
| Column | Description | Total | Hourly |
|---|---|---|---|
| Hours | Total hours logged. Includes both active time and break time. | Yes | Yes |
| Break | Time logged as Break, Lunch, or Meeting. | Yes | Yes |
| Active | Actual working time. Calculated as Hours minus Break. | Yes | Yes |
| Comp. | Number of completed surveys. | Yes | Yes |
| CPH | Completes Per Hour. Based on active (working) hours, not total hours logged. | Yes | Yes |
| Incid | Incidence rate. The percentage of contacts that resulted in a complete, calculated as: Completes / (Completes + Terminates + Over Quota). | Yes | Yes |
| Refusl | Total refusals of all types -- Soft Refusal, Hard Refusal, RHU (Refusal Hang-Up), and DNC (Do Not Call). | Yes | Yes |
| Terms | Survey terminates -- respondents who qualified to start the survey but did not complete it. | Yes | Yes |
| Prac. | Practice minutes logged. Reflects time an interviewer spent in practice/training mode. | Yes | Yes |
| LOI | Average Length of Interview, in minutes. Based on completed surveys only. Measures true survey time from introduction to last question -- does not include dialing or wrap-up time. Total section only -- not shown in the hourly columns. | Yes | No |
Navigating Wide Tables
Because each project table grows a new column group for every active hour, tables can become quite wide -- especially later in the shift. A horizontal scrollbar appears beneath each table, allowing you to scroll right to view earlier hours. The most recent hour is always visible on the left without scrolling.
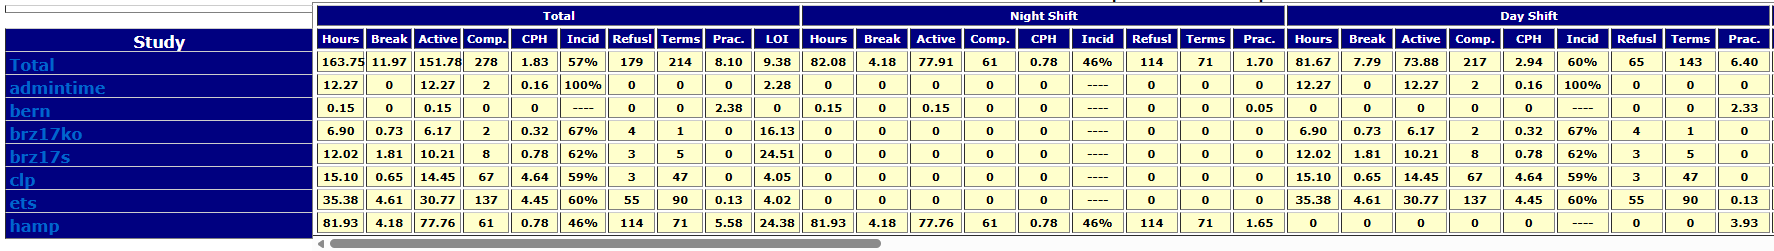
Day Shift / Night Shift Breakdown
On weekdays after 5:00 PM, the report will automatically add two additional subtotal column sections to the overall summary table (not the individual per-project tables):
- Day Shift -- Production from 9:00 AM through 4:59 PM
- Night Shift -- Production from 5:00 PM onward
This is useful for comparing how each shift performed independently, without needing to manually separate the numbers.
Historical Navigation
Below the overall summary table, the page provides links to browse to previous or next day reports:
- Yesterday's Report -- navigates one day back
- Next Day Report -- navigates one day forward (when available)
- Return to the most current report -- jumps back to today
Previous day reports can also be accessed directly via URL. The format is:
report_YYYYMMDD_v2.html
For example, to view the report for March 17, 2026, you would navigate to:
report_20260317_v2.html
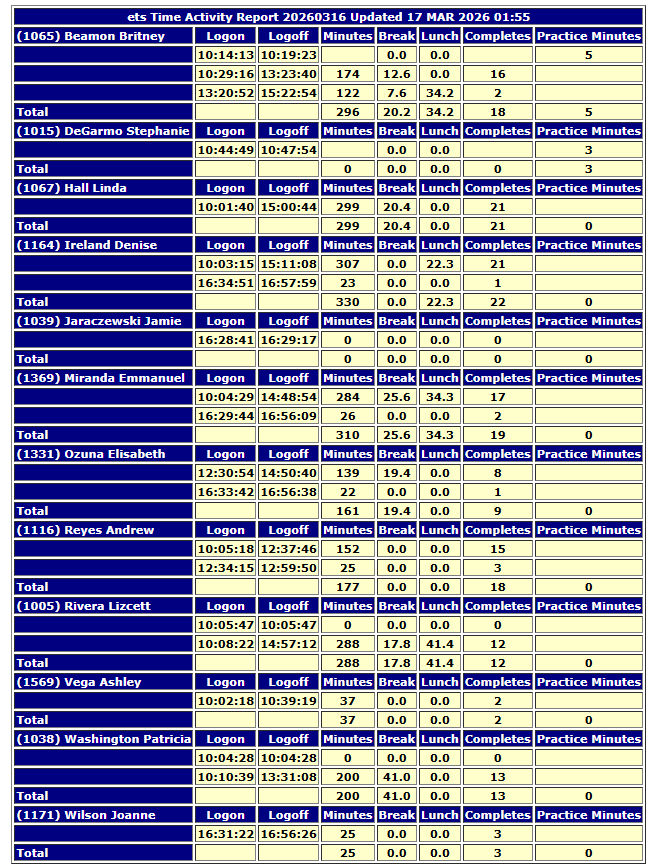
Time Detail Report
At the bottom of each per-project table is a link labeled Time Detail Report. Clicking this opens a new browser window showing a detailed punch card view for every agent on that project.
Each agent's Time Detail section includes:
- Login time
- Logout time
- Total minutes logged
- Break/Lunch minutes
- Completes during that session
- Any practice time during the login/logout window
- A total row summarizing all sessions for that agent
All login/logout sessions for a single agent are grouped together in succession, followed by a total row for that agent, before moving on to the next agent. The report is not sorted by time across all agents -- it is organized agent by agent.
Known Behaviors and Quirks
Station Number vs. Agent ID
The number shown in parentheses before an agent's name is their station number -- the workstation or dial position they logged into -- not their agent ID number. While agents are generally expected to log into their assigned station, exceptions can occur due to file locks or login errors.
This is important to keep in mind if you use the browser's Find (Ctrl+F) to search for a specific agent ID and do not get a match. The report displays station numbers, not agent IDs.
Hour-Boundary Carry-Over
Because of how the report compiles session data, an agent who is mid-survey at the top of an hour may have their time split across two hourly buckets. For example, a session that starts at 1:51 PM and ends at 2:04 PM may show 49 minutes in the 1:00 PM column and 11 minutes in the 2:00 PM column. This can cause hourly CPH figures to appear slightly off.
This is expected behavior. The overall totals will balance correctly by end of shift.
Agent Sort Order
Agents are sorted alphabetically by last name and displayed in Last, First format.
Troubleshooting and Tips
A project is not showing up on the report
If a project just went active, it may not appear yet. The report compiles on a 5-minute cycle -- wait for the next refresh and check again.
The report shows no projects, or is showing old projects from a previous day
The shift has likely not started yet. The report does not clear until the new day's shift begins at 9:00 AM. Before that time, the previous day's report will still be displayed.
A note on LOI accuracy
The LOI (Length of Interview) value shown on the report is an average of averages, not a true weighted average. Each agent's average LOI is calculated individually, and those averages are then averaged together at the project level. This means the report LOI will typically be within 1-2 minutes of the true LOI, but will not exactly match the figures in nightly production reports.
Example:
Suppose two agents complete surveys:
- Agent A completes 10 surveys averaging 8 minutes each
- Agent B completes 2 surveys averaging 14 minutes each
True average: (10 x 8) + (2 x 14) = 80 + 28 = 108 total minutes / 12 surveys = 9.0 minutes
Average of averages (what the report shows): (8 + 14) / 2 = 11.0 minutes
The difference is most noticeable when agents have significantly different survey volumes. For general monitoring purposes during a shift, the report LOI is a useful reference -- just don't use it as the authoritative figure for deliverables or client reporting.