Dashboard Overview - Shop Report
The Shop Report
What Is the Shop Report?
The Shop Report is a PhoneOps dashboard available through the MAXWell Portal under PhoneOps Dashboards in the left-hand navigation menu. It provides a shift-level overview of agent and project performance for the current workday.
The report is a static webpage that refreshes every 5 minutes, from 9:00 AM through 2:00 AM. Those viewing the page need to manually refresh to see updates, it is not automatic. All data displayed reflects two things:
- Point-in-time snapshot -- the numbers shown are as of the last time the report ran
- Cumulative totals -- figures accumulate across the full shift from open to that snapshot
Important: The Shop Report is a shift overview tool only. It is not intended for calculating production targets, incidence rates, dialer settings, or productivity metrics. Use the appropriate dedicated tools for those purposes.
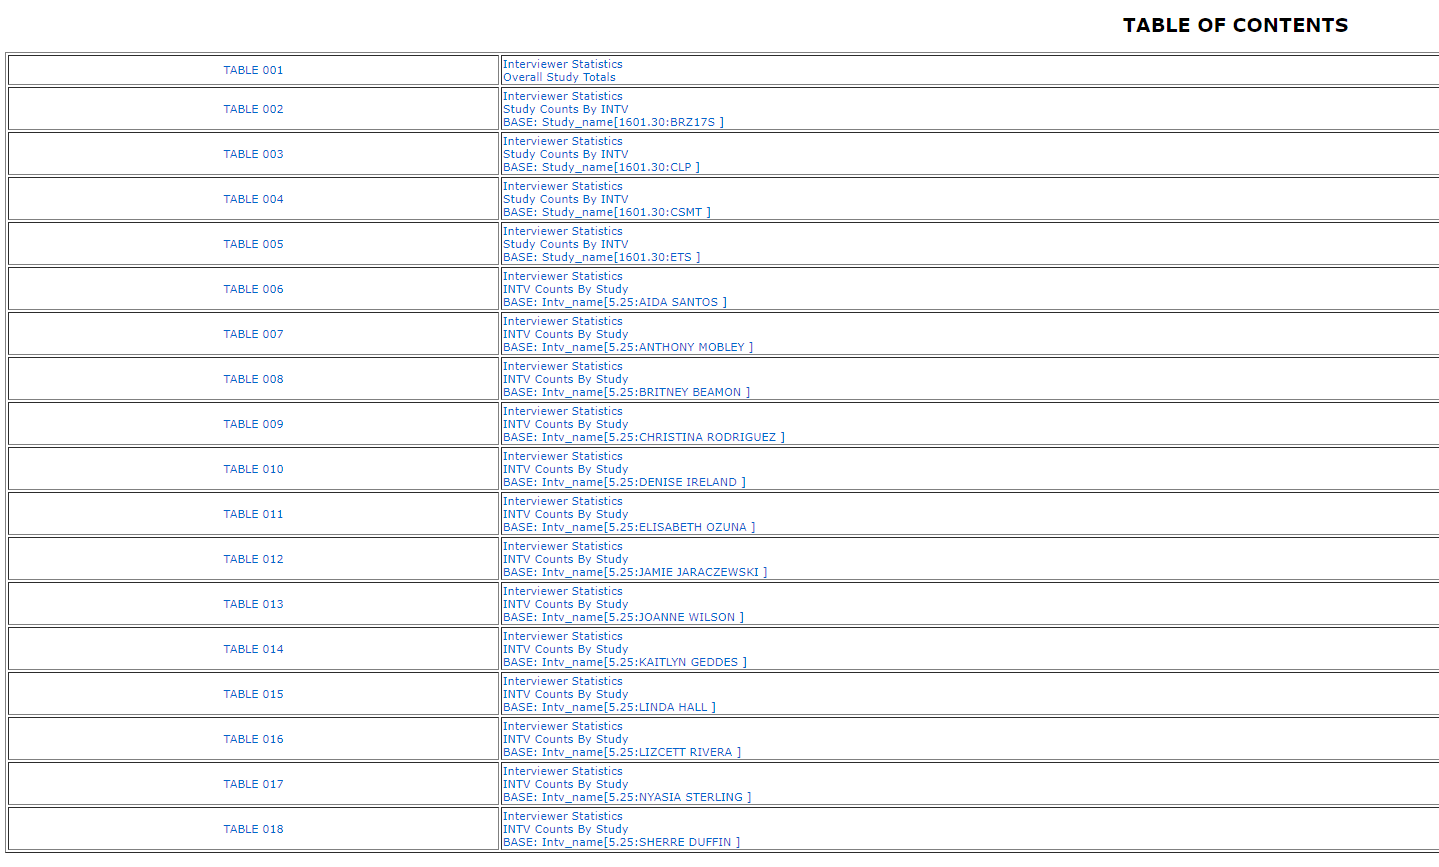
Table of Contents
At the top of every Shop Report is a clickable Table of Contents. Each entry is a hyperlink that will jump your browser directly to that section of the report. This is useful when the report is long -- particularly on heavy shift days with many active projects and agents. Rather than scrolling through the entire page, use the Table of Contents to navigate directly to the project or agent you want to review.
Report Layout
The Shop Report is organized into three sections, in this order:
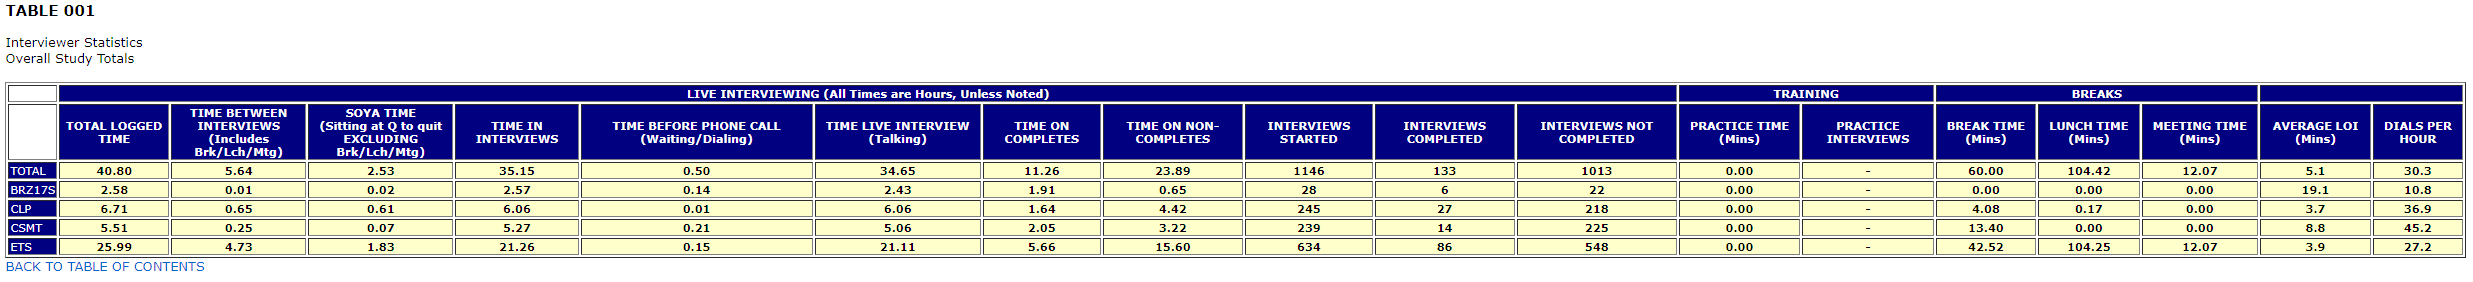
1. Overall Project Summary
The first section is a pre-job summary that rolls up all agents working the shift into a single combined row per project. No individual agent breakdown is shown here -- it is a top-level view of each project's collective numbers before drilling into the detail tables below.
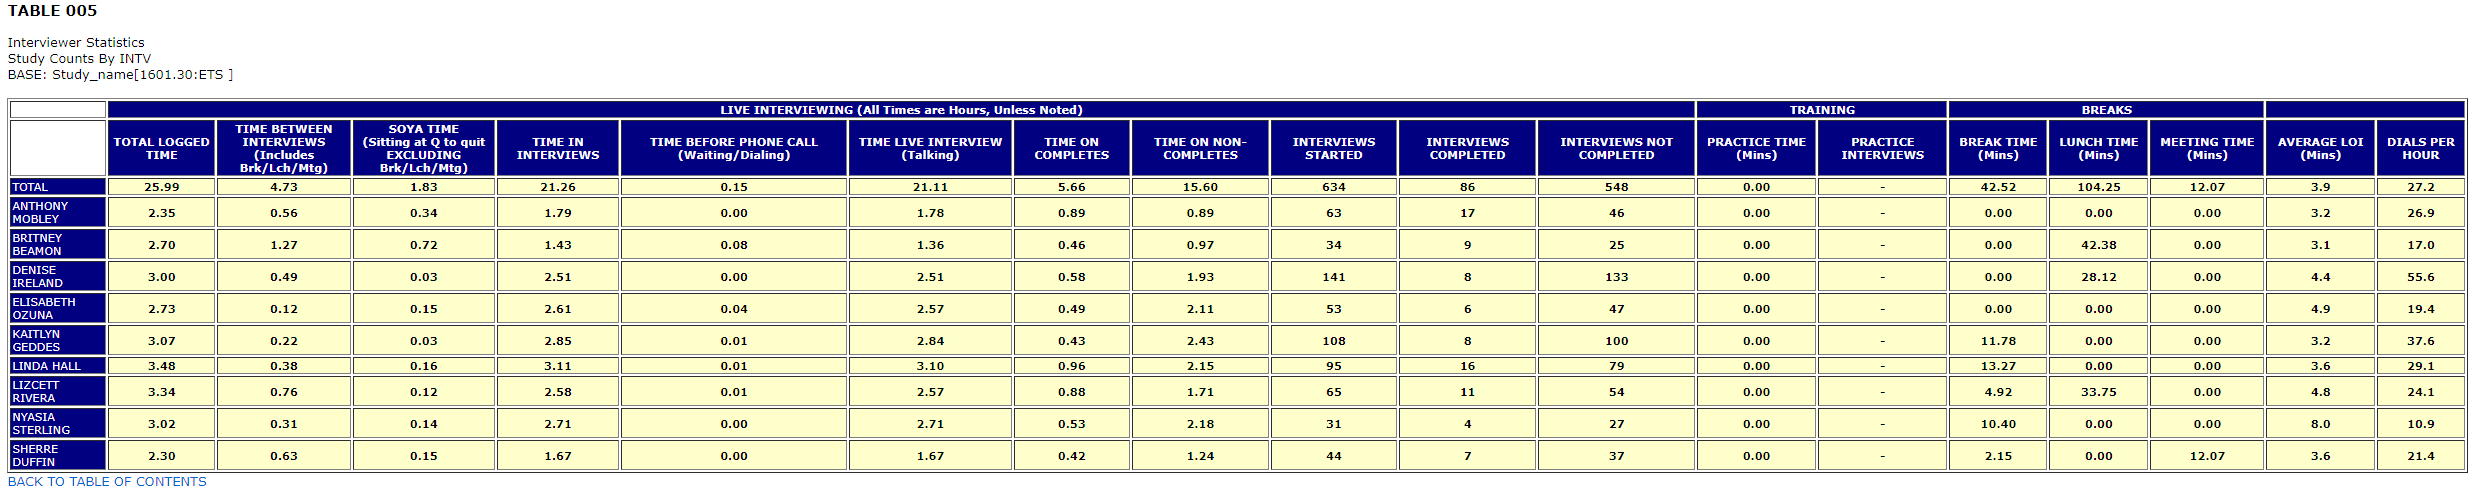
2. By-Project Tables (Broken Down by Agent)
Following the summary, there is one table for each active project. Each project table lists every agent/interviewer who worked that project during the shift, with their individual stats in each column. This view is useful when you want to evaluate how a specific project is performing and which agents are contributing to -- or dragging on -- that project's numbers.
3. By-Agent Tables (Broken Down by Project)
After all project tables, the report switches perspective. There is one table for each agent/interviewer who worked during the shift, showing their stats broken down by each project they touched. This view is useful when evaluating an individual agent's overall shift performance across all work they did that day.

Column Definitions
All tables -- whether by project or by agent -- share the same set of column headers. Definitions for each are below.
Time Columns
Total Logged In Time
The total amount of time the agent was logged into the system during the shift. This is the "clock in / clock out" window and includes all activity -- dialing, interviews, breaks, lunch, meetings, and idle time.
Time Between Interviews
The total time spent between interview attempts. This includes Break, Lunch, and Meeting time. A high value here relative to Total Logged In Time may warrant a closer look at how the agent is spending non-interview time.
SOYA Time (Sitting On Your Ass)
SOYA is a term for agents who are logged in and idle -- not actively dialing, not in an interview, and not on a logged Break, Lunch, or Meeting. In plain terms: they are on the clock but not working. SOYA time explicitly excludes Break, Lunch, and Meeting time, so there is no ambiguity -- if an agent has SOYA time, they were sitting idle with no legitimate reason logged. Supervisors should pay attention to agents with elevated SOYA values.
Time In Interviews
The total time the agent spent in the full interview cycle -- from the moment dialing began, through the live call, through to disposition. This includes Time Before Phone Call (waiting/dialing) and Time Live Interview, and covers both completed and non-completed interviews.
Time Before Phone Call
The total time the agent spent in a waiting or dialing state before a call was connected. This reflects dialer queue and ring time.
Time Live Interview
The total time the agent spent actively talking during interviews. This is the "on the phone" time only -- not wrap-up or disposition time.
Time On Completes
The total time spent on interviews that resulted in a completed survey.
Time On Non-Completes
The total time spent on interviews that did not result in a completed survey (refusals, screen-outs, disconnects, etc.).
Practice Time (Mins)
The total number of minutes the agent spent in practice/training mode interviews. Practice calls are separate from live production dialing.
Break Time (Mins)
Time logged under the Break status. This covers short departures -- bathroom breaks, grabbing a drink, stepping away briefly. This is not for extended breaks.
Lunch Time (Mins)
Time logged under the Lunch status, intended for longer break periods. Note: Many agents simply log out and log back in for lunch rather than using the Lunch status, so this value may underreport actual lunch time taken.
Meeting Time (Mins)
Time logged under the Meeting status. This is used when an agent is in a virtual meeting with a supervisor, or is conducting a post-call review with a team member (such as going over a monitoring report). It is a legitimate and expected status for quality control workflows.
Interview Count Columns
Interviews Started
The total number of interviews the agent started during the shift. An interview is considered "started" as soon as a call connects to the agent -- regardless of outcome. This includes any call that made it through to the agent/interviewer.
Interviews Completed
The number of interviews that were finished and resulted in a completed survey.
Interviews Not Completed
The number of interviews that started but did not result in a completion (refusals, screen-outs, early disconnects, etc.).
Practice Interviews
The number of interviews completed while in practice/training mode.
Calculated Columns
Average LOI (Mins)
An approximation of the average Length of Interview, in minutes, for completed surveys. It is calculated as:
Time On Completes / Interviews Completed
Because this uses total time on completes (which includes dialing and any pre-intro time), it will report higher than the official internal LOI figure, which measures only from the survey intro through the last question. Do not use this value as your authoritative LOI -- use it only as a general reference.
Dials Per Hour
This is not a true calls-per-hour metric. It is calculated as:
Interviews Started / Time In Interviews (in hours)
The denominator is Time In Interviews only -- SOYA, Break, Lunch, and Meeting time are excluded. Since "Interviews Started" only counts calls that connected to an agent -- not all dial attempts -- this figure reflects connected call rate per active interview hour, not raw dial volume.
Quick Reference -- What This Report Is and Is Not
| The Shop Report IS... | The Shop Report is NOT... |
|---|---|
| A shift-level overview of agent and project activity | A production calculation tool |
| A way to spot idle agents (SOYA) | A dialer performance or settings tool |
| A way to compare agent time usage across a shift | An incidence rate calculator |
| Updated every 5 minutes (9am - 2am) | Real-time (data is always up to 5 min behind) |
| Cumulative from shift open to last refresh | A historical or multi-day report |
Accessing Historical Snapshots
End-of-day snapshots of the Shop Report are saved automatically and archived for future reference. These are not browsable -- there is no list or calendar to click through. To access a specific date, you need to manually edit the URL in your browser's address bar.
The live report URL ends in /report.html. To load a saved snapshot, append an underscore followed by the date in YYMMDD format:
| Report | URL Format | Example |
|---|---|---|
| Live (current day) | /report.html |
/report.html |
| Specific date snapshot | /report_YYMMDD.html |
/report_250314.html (March 14, 2025) |
Simply replace YYMMDD with the two-digit year, two-digit month, and two-digit day of the date you want to view.
Troubleshooting
A job is not appearing in the report
If a project just started in the last 4 or so minutes, the report may not have refreshed yet to include it. Wait for the next 5-minute update cycle and reload the page manually.
The report is showing yesterday's data
This means no projects have run yet today. The report will continue to display the previous day's data until activity begins for the current shift.
The math looks off on an agent's row
This can happen when an agent does not properly quit out of the system at the end of their session. When this occurs, the system may still consider them active, and the final counters for that session do not get updated correctly -- resulting in calculation errors. The data shown reflects what the system recorded up to that point. Adjust your interpretation of that agent's numbers accordingly.
Data does not seem to be updating
The page does not auto-refresh in your browser. You must manually refresh the page to see the latest data. The report updates its underlying data every 5 minutes, but you will not see those updates until you reload.
In Closing
The Shop Report is one of the most frequently referenced tools available to shift supervisors. Used correctly, it gives you a fast, reliable read on how the shop is running -- who is working, who isn't, how projects are pacing, and where time is being spent. Keep in mind its core limitations: it is a snapshot, not a live feed; it is a shift overview, not a production or dialer analysis tool; and some figures (LOI, Dials Per Hour) are approximations by design. As long as you are reading it in that context, it is an effective and efficient part of your shift management workflow.
For questions about the Shop Report or to report a data issue, contact IT.