V. Reference Documents
A section dedicated more to "how things work" and not necessarily how to use/fix things. Think of these are technical manuals for the various Survox Systems/Tools
- Reference Material - Survox Dialer
- Reference Material - Standard Phone Disposition (Dispo) Codes
- Dashboard Overview - Shop Report
- Dashboard Overview - Dialer Dashboard Report
- Dashboard Overview - INTV Realtime Report
- Dashboard Overview - Production Report
- How To: Caller ID/LCP Settings & Call Interceptor Program
Reference Material - Survox Dialer
How the Survox Predictive Dialer Works
Overview
The Survox dialer is not a simple "ratio dialer" where you set a fixed number like "dial 3 calls per agent." It is a predictive dialer driven by a live, dynamic algorithm that constantly adjusts how aggressively it dials based on what is happening on the floor in real time. Understanding how it works helps explain why contact rates change throughout a shift, why adding more agents does not always mean more dials, and why some nights perform better than others even with the same numbers.
The Algorithm Inputs
The dialer does not run on a fixed timer. Instead, it recalculates every time a job determines that more numbers need to be dialed -- typically because agents are waiting and available. Each time that happens, the following inputs are evaluated for that job:
- Drop Rate (Actual vs. Target) -- The dialer tracks a configured drop threshold expressed as a value per 10,000 connects. A setting of 350, for example, means the system will tolerate up to 3.5% of connects resulting in a drop. The dialer does not simply try to stay under this number -- it actively tries to dial as aggressively as possible while landing just below the drop target. The live drop rate updates every time the algorithm fires.
When the drop rate exceeds the configured target, the dialer does not make a small adjustment -- it throttles back aggressively, dropping to near 1:1 dialing until the drop rate falls back below the threshold. Once recovered, it begins climbing back toward the 3:1 cap again. This recovery behavior can cause noticeable slowdowns on the floor and is why sustained high drop rates are worth monitoring closely.
- Number of Available Agents -- The dialer evaluates how many agents are waiting and not currently on a call for that job. This is what triggers the recalculation in the first place. No waiting agents means no new dials.
- Real-Time Connect Rate -- The connect rate also updates every time the algorithm fires. When the contact rate is high, agents are busy more often, the dialer does not need to push as hard to keep them occupied, and drop risk is lower. When the contact rate is low, agents are idle more often, the dialer pushes closer to the 3:1 cap to compensate, and the chance of a drop increases.
- Capacity Settings (Two Hard Limits) -- Regardless of what the algorithm calculates, two hard caps always apply together:
- Max 3 calls per waiting agent
- Max 30 calls per second system-wide
Each job runs this calculation independently for itself. The shared 375-channel pool only becomes a factor if the combined math across all running jobs -- total active agents across all jobs multiplied by 3 -- would push past the 375-channel ceiling. In most normal operating conditions, that ceiling is never reached, and each job dials freely without any competition from other jobs.
What a "Drop" Actually Means
This is one of the most commonly misunderstood parts of how the dialer works.
A dropped call is NOT a respondent who picks up and then hangs up before reaching an agent. A dropped call is the dialer itself hanging up early -- before the call is ever answered -- because the algorithm has determined there is a risk that no agent will be available if the respondent picks up.
Even if the project is configured for 4 rings before abandoning, the dialer may cut a call off at 1, 2, or 3 rings if it calculates that sending that call through to a live pickup would create an agent availability problem. The respondent's phone may ring once or twice with no connection ever made from their perspective, and the dialer has already moved on.
This is intentional behavior. The dialer is constantly protecting the agent pool from being overwhelmed by live contacts with no one to handle them. And rather than simply avoiding drops, the algorithm actively hunts for the highest possible contact rate it can sustain while keeping drops just under the configured threshold.
Session Capacity and the 375-Channel Ceiling
Maximum Research has 375 concurrent call channels provided by the telco. Think of these as 375 phone lines that can be active at the same time across all dialing activity.
However, in normal operations, the 375-channel ceiling is rarely the actual constraint. The real practical limit is the "3 calls per waiting agent" rule combined with the 30 calls per second cap. Both apply at all times.
Example:
- 30 agents on the floor x 3 calls each = 90 channels maximum
- 375 channels available from telco
- 285 channels sitting completely idle
This is by design. The 3:1 rule was set because at our peak staffing of 100 to 110 agents, the math works out to:
- 110 agents x 3 calls = 330 channels needed at peak
- 375 available from telco
- 45-channel buffer (about 14% headroom)
This ensures that even on our busiest possible night, we never hit the telco ceiling and create a bottleneck.
Why Fewer Agents Can Mean More Dials Per Agent
This is counterintuitive but important. When fewer agents are working, the drop rate risk is lower because fewer calls are connecting overall, which allows the algorithm to dial more aggressively per agent.
Example comparison:
Night A -- 38 agents, high connect rate (7%)
- 38 x 3 = 114 max calls at once
- High connect rate means agents are busy -- dialer does not need to push as hard
- Drop risk is lower, but so is the need to dial aggressively
- Result: roughly 326 calls per hour
Night B -- 29 agents, lower connect rate (6.4%)
- 29 x 3 = 87 max calls at once
- Low connect rate means agents are idle more often -- dialer pushes closer to 3:1
- Greater drop risk, but algorithm pushes hard to stay just under the target
- Result: roughly 350 calls per hour
Night B made more calls per hour despite fewer agents. The algorithm pushing closer to the 3:1 cap to compensate for the lower contact rate was the deciding factor.
How Multiple Jobs Share Channels
Each job calculates its own dialing needs independently. In most cases, multiple jobs running simultaneously have no meaningful impact on each other, because the combined agent count across all jobs multiplied by 3 stays well under the 375-channel ceiling.
Channel competition only becomes a real factor if total active agents across all running jobs would push the combined demand past 375. If that threshold were approached, jobs with more agents would carry more weight in claiming available channels, and the per-job drop rate and connect rate at that moment would further influence how many channels each job actually receives.
Under normal staffing conditions at Maximum Research, this ceiling is not a practical concern.
What This Means Operationally
- Early shift behavior is aggressive, not conservative. Because connect rate and drop rate values start at zero, the dialer has nothing to constrain it and immediately pushes toward the 3:1 cap. The result is that the majority of dropped calls typically occur early in a shift, with large swings between the actual drop rate and the target until enough call volume accumulates for the pattern to normalize.
- Staffing level directly affects dialing behavior. More agents means more channels consumed, but a higher contact rate also means agents are busier and the dialer does not need to push as hard. There is a sweet spot -- typically around 25 to 35 agents for a single job -- where the algorithm can push closest to the drop threshold while maximizing contacts.
- Two jobs running simultaneously is not a problem under normal staffing. Each job manages its own dialing independently and draws from the shared channel pool without conflict, as long as combined session demand stays under 375.
- The 30 calls per second cap is a hard system limit that exists independently of everything else. On a typical night we do not come close to it, but it is there as a safeguard against runaway dialing.
A Note on the Dashboard
The Survox dialer dashboard updates its displayed statistics every 10 to 15 seconds. This is intentional -- frequent screen refreshes create overhead, and the dashboard is a reporting display, not the calculation engine. The dialer itself is recalculating and firing far faster than what the dashboard reflects. Do not assume that what you see on the dashboard represents the dialer's current state at that exact moment.
Summary
The Survox predictive dialer is a self-regulating system. It is event-driven -- each job recalculates independently every time its agents are waiting and more dials are needed -- rather than running on a fixed clock. Its goal is not simply to stay within the configured drop threshold, but to find the highest possible contact rate it can sustain while landing just below that threshold.
Because of this, the dialer is always running as fast as the current conditions allow for each job. If a job is already hitting the 3:1 capacity ceiling and the drop target is not being exceeded, raising the drop target will have no effect -- the dialer is already at maximum speed and the drop rate simply reflects the contact conditions that exist.
Multiple jobs running simultaneously operate independently without interfering with each other, unless combined session demand across all jobs approaches the 375-channel ceiling -- a situation that does not occur under normal staffing conditions at Maximum Research.
Reference Material - Standard Phone Disposition (Dispo) Codes
About Disposition Codes
Every time the Survox phone system touches a sample record - whether the dialer places the call, an interviewer speaks to someone, or the server processes a number behind the scenes - a disposition code is written to that record. This code is the system's way of recording exactly what happened and what should happen next.
Disposition codes control the entire lifecycle of a phone number through a study. They determine whether a record gets redialed, sits in a hold area, or is permanently closed out. Understanding them is essential for anyone managing a study, troubleshooting a sample, or interpreting production reports.
By default, Survox stores the last 12 calls made to a number, and each of those calls will contain one of these codes shown. The call result is stored in two spots of the phone numbers associated record. [6003.3] holds the "last attempt made" while 6103.3 is the first attempt, 6203.3 is the second attempt, 6303.3 is third and so on up until 7203.3 for the 12th attempt.
The below table uses two flags for each code:
Connect? Whether a live person (or at minimum, a live phone connection) was reached. Yes means the call got through in some form.
Resolved? Whether the record is permanently closed. Yes means Survox will not attempt this number again. No means the record remains eligible for future dial attempts, subject to study settings.
Codes are organized by number range, each group representing where in the system that outcome originated: manual interviewer action, the predictive dialer, or internal server/system logic.
Complete Disposition Code Reference
|
Code |
Definition |
Connect? |
Resolved? |
|
001-099 | Standard Outcome Codes (set by interviewer or survey logic) |
|||
|
001 |
Complete |
Yes |
Yes |
|
002 |
Not Currently Used |
Yes |
Yes |
|
003 |
Language Barrier (Non-Spanish) |
Yes |
Yes |
|
004 |
Not Currently Used |
Yes |
Yes |
|
005 |
Non-Working Number |
No |
Yes |
|
006 |
Business/Government Number |
Yes |
Yes |
|
007 |
Not Currently Used |
Yes |
Yes |
|
009 |
Fax/CPU Tone Number |
No |
Yes |
|
010 |
INTV Coded as Duplicate Number |
Yes |
Yes |
|
011 |
No Such Person / Wrong Number |
Yes |
Yes |
|
012 |
Not Currently Used |
No |
Yes |
|
013 |
Against Company Policy |
Yes |
Yes |
|
014 |
Number Added to DNC List |
Yes |
Yes |
|
015 |
Respondent Hard Refusal or 2x Soft Refusal |
Yes |
Yes |
|
016 |
Not Currently Used |
No |
Yes |
|
017 |
Over Quota - Question Driven |
Yes |
Yes |
|
018 |
Suspend -> Over Quota |
Yes |
Yes |
|
019 |
Not Currently Used |
No |
Yes |
|
020 |
Qualified Refusal |
Yes |
Yes |
|
021 |
Question Terminate (see Statcode in QPX) |
Yes |
Yes |
|
022 |
Question Terminate (see Statcode in QPX) |
Yes |
Yes |
|
... |
includes all codes between 21-60 |
Yes |
Yes |
|
060 |
Question Terminate (see Statcode in QPX) |
Yes |
Yes |
|
069 |
Complete Pulled Up by INTV |
No |
Yes |
|
099 |
Dialer Got 4 No Answers in a Row |
No |
Yes |
|
Code |
Definition |
Connect? |
Resolved? |
|
101-213 | Active / Live Codes (record remains available for redialing) |
|||
|
101 |
No Answer |
No |
No |
|
102 |
Busy |
No |
No |
|
103 |
Busy Changed to No Answer (2 busy in a row become No Answer) |
No |
No |
|
104 |
Callback (Specified date/time) |
Yes |
No |
|
105 |
Callback (Unspecified) |
Yes |
No |
|
106 |
Callback (Tomorrow) |
Yes |
No |
|
107 |
Answering Machine / Voicemail |
Yes |
No |
|
121 |
Dialer Dead Air / Sent No One |
No |
No |
|
152 |
Spam Busy |
No |
No |
|
156 |
Get Specific Stack (pull by search only) |
No |
No |
|
182 |
Busy Forced to No Answer (retry was outside calling hours) |
No |
No |
|
183 |
Not Currently Used |
No |
No |
|
185 |
Respondent Hung Up in Intro (Bucket 9 / Hold Area) |
Yes |
No |
|
187 |
All Targeted Attempts Made |
No |
No |
|
189 |
Soft Refusal (Bucket 9 / Hold Area) |
Yes |
No |
|
191 |
Special Status 1 - Spanish Speaking |
Yes |
No |
|
192 |
Special Status 2 |
No |
No |
|
193 |
Special Status 3 |
No |
No |
|
194 |
Special Status 4 - Terminate in Middle / Dead Suspend |
Yes |
No |
|
195 |
Special Status 5 |
No |
No |
|
196 |
Special Status 6 |
No |
No |
|
197 |
Special Status 7 - "Dead" Suspend (TERM_IN_MID) |
Yes |
No |
|
198 |
Special Status 8 |
No |
No |
|
199 |
Special Status 9 - Respondent Not Available for Study Duration |
Yes |
No |
|
211 |
Put Back - Top of List |
No |
No |
|
212 |
Put Back - Bottom of List |
No |
No |
|
213 |
Send to Hidden Bucket |
No |
No |
|
Code |
Definition |
Connect? |
Resolved? |
|
801-821 | Dialer - Resolved (dialer-assigned, record is closed) |
|||
|
801 |
Dialer: Number Not Dialed |
No |
Yes |
|
802 |
Dialer: Timed Number Not Dialed |
No |
Yes |
|
803 |
Dialer: Unknown Number |
No |
Yes |
|
804 |
Not Currently Used |
No |
Yes |
|
807 |
Dialer: Bad Number |
No |
Yes |
|
808 |
Dialer: Modem Answered |
No |
Yes |
|
809 |
Dialer: Disconnected |
No |
Yes |
|
810 |
Dialer: Forced Resolved |
No |
Yes |
|
811 |
Not Currently Used |
No |
Yes |
|
812 |
Dialer: Changed Number |
No |
Yes |
|
815 |
Dialer: Number Too Old to Call |
No |
Yes |
|
818 |
Dialer: SIP Non-Working |
No |
Yes |
|
819 |
Dialer: No Connect |
No |
Yes |
|
821 |
Dialer: INTV Disconnect |
No |
Yes |
|
Code |
Definition |
Connect? |
Resolved? |
|
851-875 | Dialer - Active (dialer-assigned, record remains in play) |
|||
|
851 |
Dialer: No Answer |
No |
No |
|
852 |
Dialer: Busy |
No |
No |
|
853 |
Dialer: Busy to No Answer |
No |
No |
|
854 |
Dialer: Trunk-Line Busy |
No |
No |
|
855 |
Dialer: Incomplete Callback |
No |
No |
|
856 |
Dialer: Nuisance (Dropped) Call |
No |
No |
|
857 |
Dialer: Answering Machine |
No |
No |
|
859 |
Dialer: Hung Up Phone |
No |
No |
|
860 |
Not Currently Used |
No |
No |
|
861 |
Dialer: Connect then Abort |
No |
No |
|
862 |
Not Currently Used |
No |
No |
|
863 |
Dialer: No Ringback |
No |
No |
|
864 |
Dialer: Connected ATD |
No |
No |
|
870 |
Dialer: Rejected Call |
No |
No |
|
871 |
Dialer: No User Responding |
No |
No |
|
872 |
Dialer: Channel Unavailable |
No |
No |
|
873 |
Dialer: Temp Failure |
No |
No |
|
875 |
Network Bad (likely temporary failure) |
No |
No |
|
Code |
Definition |
Connect? |
Resolved? |
|
900-908 | Survent / Station Codes (set by the interviewer station or survey engine) |
|||
|
900 |
Number 'In the Air' (at the interviewer station) |
No |
No |
|
901 |
Survent: Blow Error |
No |
No |
|
902 |
Survent: SIGHUP / Terminal Abort / Suspend-Callback in 24 hrs |
No |
No |
|
903 |
Survent: Auto-Suspended (web survey) |
No |
No |
|
904 |
Not Currently Used |
No |
No |
|
905 |
Survent: Suspended Due to Max Idle Time |
No |
No |
|
906 |
Not Currently Used |
No |
No |
|
907 |
Phone Quota Retry (was 997 - rescheduled like a busy) |
No |
No |
|
908 |
Phone Cluster Retry (was 998 - rescheduled like a busy) |
No |
No |
|
Code |
Definition |
Connect? |
Resolved? |
|
950-999 | Server / System Codes (assigned by server logic, not interviewer action) |
|||
|
950 |
Not Currently Used |
No |
No |
|
951 |
Server: Duplicate Number Found - Do Not Call |
No |
Yes |
|
952 |
Server: Number in DNC Prefix List - Do Not Call |
No |
Yes |
|
953 |
Server: Number in DNC List - Do Not Call |
No |
Yes |
|
954 |
Number Completed by Validator |
No |
No |
|
955 |
Phone Number Killed by Foneutil or Super/Boss |
No |
Yes |
|
956 |
Server: Number in DNC Email List - Do Not Call |
No |
Yes |
|
971 |
Forced Resolved by Dialer |
No |
No |
|
972 |
Not Currently Used |
No |
No |
|
973 |
Max Calls Limit Reached |
No |
No |
|
974 |
Max Calls Ever Reached |
No |
No |
|
975 |
Over Phone Quota - Resolved |
No |
No |
|
976 |
Over Quota Percent - Resolved |
No |
No |
|
977 |
Dialer Failed Transfer to Validator |
No |
No |
|
978 |
Server Failed Transfer to Validator |
No |
No |
|
979 |
Not Currently Used |
No |
No |
|
980 |
Bad Status Set |
No |
No |
|
983 |
Bad Phone Record |
No |
No |
|
984 |
Dialer Status Returned with No Corresponding CfMC Status |
No |
No |
|
985 |
Invalid Time in Timed Callback |
No |
No |
|
986 |
Bad 'Putfone' With Zero in Field |
No |
No |
|
987 |
Bad Stuff in Phone Record |
No |
No |
|
988 |
Unknown Status |
No |
No |
|
989 |
Bad Special Interviewer Type Value |
No |
No |
|
990 |
No Stack Found |
No |
No |
|
991 |
Max History Check Error |
No |
No |
|
992 |
No Next Bucket |
No |
No |
|
993 |
Bad 'Putfone' |
No |
No |
|
994 |
Number Identified as an "Error Record" |
No |
Yes |
|
999 |
Reserved - !phone,s (use status in specified location) |
No |
No |
Notes on Code Usage
*Question Terminates (021-060): These codes are set programmatically within the survey itself. What each one means depends entirely on how the programmer set up the QPX statcode logic for that specific study. There is no universal meaning - always refer to the study's QPX file to interpret these.
**Special Statuses (191-199): General-purpose hold codes whose meaning is defined at the study level. Codes 191, 194, 197 and 199 are the most commonly assigned with consistent meaning: mid-interview termination and extended respondent unavailability, respectively.
***Not Currently Used: These code slots exist in the system but are not actively assigned. They should not appear in normal study logs. If encountered, it typically indicates a system anomaly or a very old study configuration.
****Missing Codes: Some codes are explicitly missing from the list, as they are either "reserved" for future use, or specific to a dialer other than the Survox Dialer.
*****Dialer: Rejected Code: These are a newer code that has started to appear, as a result of carriers implementing call screening services. While survox treats these as system numbers, and tries calling them back on the normal system callback times, carriers have identified they are being rejected and are either invalid or spam blocked, and thus never going to reach a respondent. If a large quantity of these start appearing, you can ask DP to "kill" them, so they no longer get redialed.
******Error Records: These are the last great mystery of Survox sample management... MOST OF THE TIME they are simply a disconnected number, but the code the end carrier sent back is not one the dialer knows how to handle, so it just dumps them into the "Error Status" stack. In theory, these could be zapped and tried again but would most likely result in the same status being sent back again. There are also rare occasions where a number gets somehow "corrupted" via strange callback times, or other system issues. This happens very infrequently though and should be investigated when it happens. Note: When dialing in 1:1 mode, these are "changed" to normal disconnected.
*******Killing Numbers: At times, it may be required to "kill" numbers, assigning a status "955" and removing them from dialing completely. This can be done similar to hiding/revealing, in a super/boss using the phone_kill jobname select <enter> or in the Console under Manage, Manage Sample, Resolve Numbers, and putting in the select statement.
Dashboard Overview - Shop Report
The Shop Report
What Is the Shop Report?
The Shop Report is a PhoneOps dashboard available through the MAXWell Portal under PhoneOps Dashboards in the left-hand navigation menu. It provides a shift-level overview of agent and project performance for the current workday.
The report is a static webpage that refreshes every 5 minutes, from 9:00 AM through 2:00 AM. Those viewing the page need to manually refresh to see updates, it is not automatic. All data displayed reflects two things:
- Point-in-time snapshot -- the numbers shown are as of the last time the report ran
- Cumulative totals -- figures accumulate across the full shift from open to that snapshot
Important: The Shop Report is a shift overview tool only. It is not intended for calculating production targets, incidence rates, dialer settings, or productivity metrics. Use the appropriate dedicated tools for those purposes.
Table of Contents
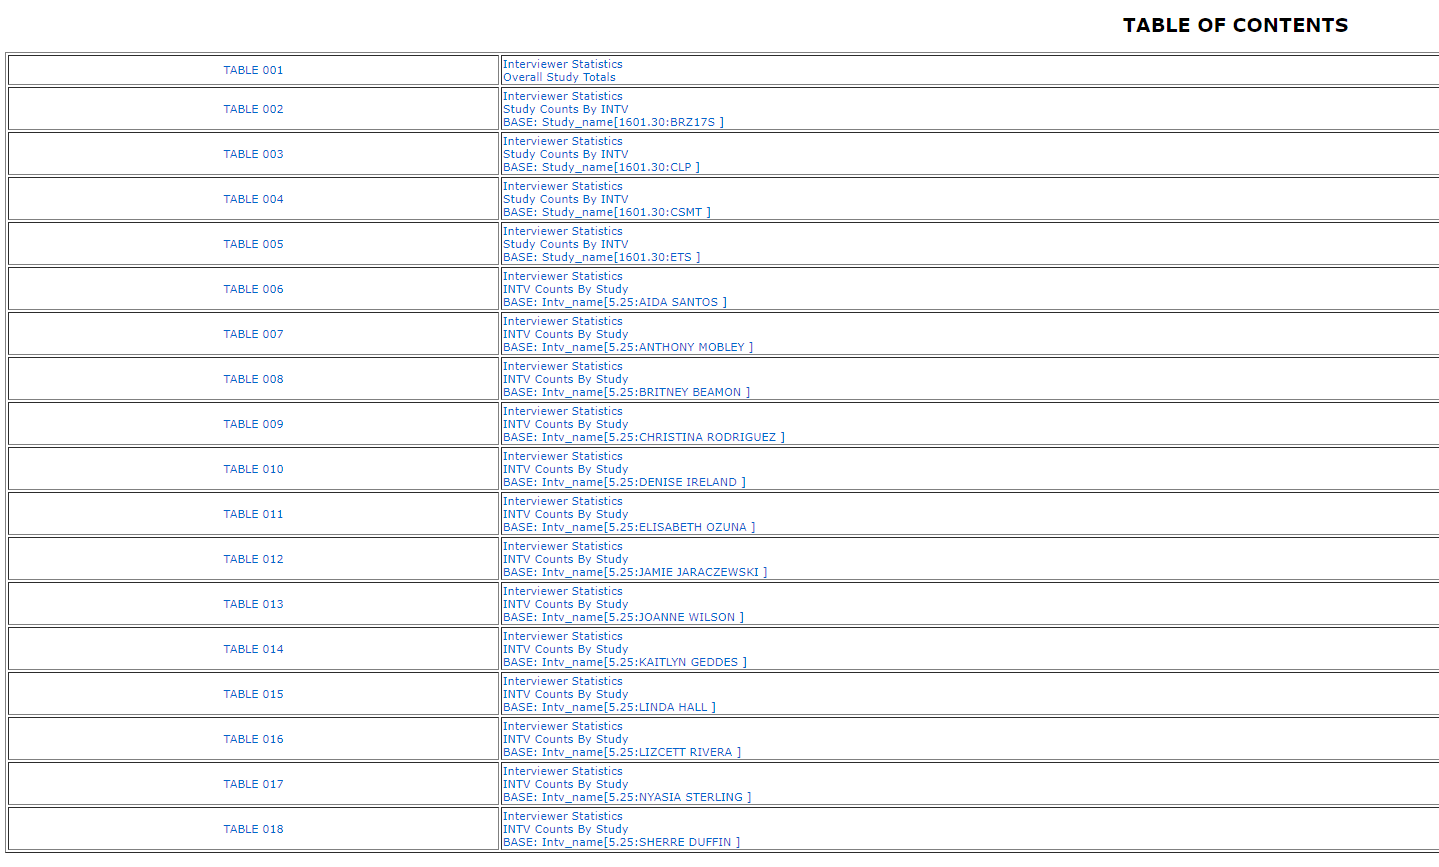
At the top of every Shop Report is a clickable Table of Contents. Each entry is a hyperlink that will jump your browser directly to that section of the report. This is useful when the report is long -- particularly on heavy shift days with many active projects and agents. Rather than scrolling through the entire page, use the Table of Contents to navigate directly to the project or agent you want to review.
Report Layout
The Shop Report is organized into three sections, in this order:
1. Overall Project Summary
The first section is a pre-job summary that rolls up all agents working the shift into a single combined row per project. No individual agent breakdown is shown here -- it is a top-level view of each project's collective numbers before drilling into the detail tables below.

2. By-Project Tables (Broken Down by Agent)
Following the summary, there is one table for each active project. Each project table lists every agent/interviewer who worked that project during the shift, with their individual stats in each column. This view is useful when you want to evaluate how a specific project is performing and which agents are contributing to -- or dragging on -- that project's numbers.

3. By-Agent Tables (Broken Down by Project)
After all project tables, the report switches perspective. There is one table for each agent/interviewer who worked during the shift, showing their stats broken down by each project they touched. This view is useful when evaluating an individual agent's overall shift performance across all work they did that day.

Column Definitions
All tables -- whether by project or by agent -- share the same set of column headers. Definitions for each are below.
Time Columns
Total Logged In Time
The total amount of time the agent was logged into the system during the shift. This is the "clock in / clock out" window and includes all activity -- dialing, interviews, breaks, lunch, meetings, and idle time.
Time Between Interviews
The total time spent between interview attempts. This includes Break, Lunch, and Meeting time. A high value here relative to Total Logged In Time may warrant a closer look at how the agent is spending non-interview time.
SOYA Time (Sitting On Your Ass)
SOYA is a term for agents who are logged in and idle -- not actively dialing, not in an interview, and not on a logged Break, Lunch, or Meeting. In plain terms: they are on the clock but not working. SOYA time explicitly excludes Break, Lunch, and Meeting time, so there is no ambiguity -- if an agent has SOYA time, they were sitting idle with no legitimate reason logged. Supervisors should pay attention to agents with elevated SOYA values.
Time In Interviews
The total time the agent spent in the full interview cycle -- from the moment dialing began, through the live call, through to disposition. This includes Time Before Phone Call (waiting/dialing) and Time Live Interview, and covers both completed and non-completed interviews.
Time Before Phone Call
The total time the agent spent in a waiting or dialing state before a call was connected. This reflects dialer queue and ring time.
Time Live Interview
The total time the agent spent actively talking during interviews. This is the "on the phone" time only -- not wrap-up or disposition time.
Time On Completes
The total time spent on interviews that resulted in a completed survey.
Time On Non-Completes
The total time spent on interviews that did not result in a completed survey (refusals, screen-outs, disconnects, etc.).
Practice Time (Mins)
The total number of minutes the agent spent in practice/training mode interviews. Practice calls are separate from live production dialing.
Break Time (Mins)
Time logged under the Break status. This covers short departures -- bathroom breaks, grabbing a drink, stepping away briefly. This is not for extended breaks.
Lunch Time (Mins)
Time logged under the Lunch status, intended for longer break periods. Note: Many agents simply log out and log back in for lunch rather than using the Lunch status, so this value may underreport actual lunch time taken.
Meeting Time (Mins)
Time logged under the Meeting status. This is used when an agent is in a virtual meeting with a supervisor, or is conducting a post-call review with a team member (such as going over a monitoring report). It is a legitimate and expected status for quality control workflows.
Interview Count Columns
Interviews Started
The total number of interviews the agent started during the shift. An interview is considered "started" as soon as a call connects to the agent -- regardless of outcome. This includes any call that made it through to the agent/interviewer.
Interviews Completed
The number of interviews that were finished and resulted in a completed survey.
Interviews Not Completed
The number of interviews that started but did not result in a completion (refusals, screen-outs, early disconnects, etc.).
Practice Interviews
The number of interviews completed while in practice/training mode.
Calculated Columns
Average LOI (Mins)
An approximation of the average Length of Interview, in minutes, for completed surveys. It is calculated as:
Time On Completes / Interviews Completed
Because this uses total time on completes (which includes dialing and any pre-intro time), it will report higher than the official internal LOI figure, which measures only from the survey intro through the last question. Do not use this value as your authoritative LOI -- use it only as a general reference.
Dials Per Hour
This is not a true calls-per-hour metric. It is calculated as:
Interviews Started / Time In Interviews (in hours)
The denominator is Time In Interviews only -- SOYA, Break, Lunch, and Meeting time are excluded. Since "Interviews Started" only counts calls that connected to an agent -- not all dial attempts -- this figure reflects connected call rate per active interview hour, not raw dial volume.
Quick Reference -- What This Report Is and Is Not
| The Shop Report IS... | The Shop Report is NOT... |
|---|---|
| A shift-level overview of agent and project activity | A production calculation tool |
| A way to spot idle agents (SOYA) | A dialer performance or settings tool |
| A way to compare agent time usage across a shift | An incidence rate calculator |
| Updated every 5 minutes (9am - 2am) | Real-time (data is always up to 5 min behind) |
| Cumulative from shift open to last refresh | A historical or multi-day report |
Accessing Historical Snapshots
End-of-day snapshots of the Shop Report are saved automatically and archived for future reference. These are not browsable -- there is no list or calendar to click through. To access a specific date, you need to manually edit the URL in your browser's address bar.
The live report URL ends in /report.html. To load a saved snapshot, append an underscore followed by the date in YYMMDD format:
| Report | URL Format | Example |
|---|---|---|
| Live (current day) | /report.html |
/report.html |
| Specific date snapshot | /report_YYMMDD.html |
/report_250314.html (March 14, 2025) |
Simply replace YYMMDD with the two-digit year, two-digit month, and two-digit day of the date you want to view.
Troubleshooting
A job is not appearing in the report
If a project just started in the last 4 or so minutes, the report may not have refreshed yet to include it. Wait for the next 5-minute update cycle and reload the page manually.
The report is showing yesterday's data
This means no projects have run yet today. The report will continue to display the previous day's data until activity begins for the current shift.
The math looks off on an agent's row
This can happen when an agent does not properly quit out of the system at the end of their session. When this occurs, the system may still consider them active, and the final counters for that session do not get updated correctly -- resulting in calculation errors. The data shown reflects what the system recorded up to that point. Adjust your interpretation of that agent's numbers accordingly.
Data does not seem to be updating
The page does not auto-refresh in your browser. You must manually refresh the page to see the latest data. The report updates its underlying data every 5 minutes, but you will not see those updates until you reload.
In Closing
The Shop Report is one of the most frequently referenced tools available to shift supervisors. Used correctly, it gives you a fast, reliable read on how the shop is running -- who is working, who isn't, how projects are pacing, and where time is being spent. Keep in mind its core limitations: it is a snapshot, not a live feed; it is a shift overview, not a production or dialer analysis tool; and some figures (LOI, Dials Per Hour) are approximations by design. As long as you are reading it in that context, it is an effective and efficient part of your shift management workflow.
For questions about the Shop Report or to report a data issue, contact IT.
Dashboard Overview - Dialer Dashboard Report
The Dialer Dashboard is a real-time view of dialing activity across all active projects. It is accessible through the MAXWell Portal via the PhoneOps Dashboard option in the left-side navigation menu.
The dashboard refreshes automatically every 15 seconds and is active between 9:00 AM and 2:00 AM daily, covering the full span of dialing operations.
Dashboard Layout
The dashboard is organized into two main sections:
Overall Study Summary
The top section displays a single rolled-up row per project, combining the activity of all agents currently working that project into one summary line. This gives ops staff and PDs a quick at-a-glance view of how each project is performing across the floor without having to dig into individual agent detail.

Per-Project Breakdown
Below the summary, each project is displayed individually with its own table. Each table lists one row per agent currently working that project, identified by their numeric Agent ID in the leftmost column. At the bottom of each table is a row labeled SRVR, which represents calls that were dispositioned automatically by the dialer before ever reaching an agent -- interviewers do not see these calls.

Call Results Details
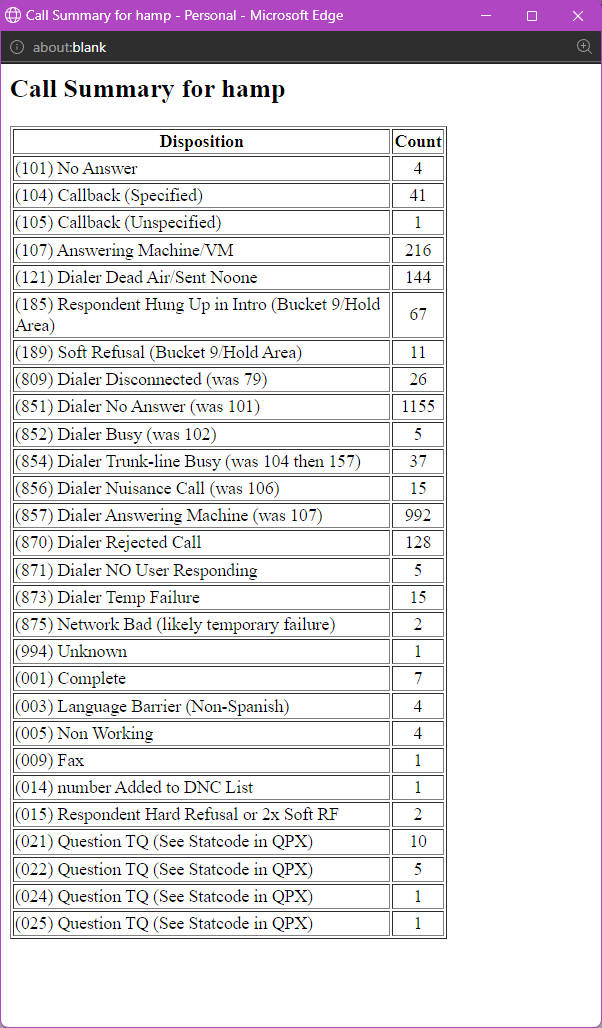
Next to each project name in the per-project breakdown is a "Click here to see Call Results Details" link. Clicking it opens a small pop-up window listing every call result code recorded for that project since the start of the current day, along with its count.
This is particularly useful when the Resolved column shows a high number -- the pop-up lets you quickly see which specific resolved codes are driving that count (for example, a spike in disconnected numbers, wrong numbers, or fax tones) without having to pull a separate report.
Column Sets
Every row -- whether in the summary or the per-project breakdown -- displays three sets of columns: Total, Current Hour, and Last Hour. All three sets share the same column definitions, described below.
Column Definitions
The following columns appear under each of the three time-period sets.
Dialed
The total number of phone numbers attempted by the dialer or agents in 1:1 mode, regardless of how the call ended. Any number the system touched counts here.
Connected
The number of calls where a connection was established and the call was passed to an agent or interviewer to handle. A connected call means a live respondent (or answering machine) was reached and handed off.
Dropped / DNO1
A combined count of two related non-productive outcomes:
- Dropped -- calls where the dialer hung up before reaching 4 rings (dialer-initiated drop).
- DNO1 (Dialer Sent No One) -- calls where the respondent answered but hung up before the call could be connected to an available agent/interviewer. *These are a gray area, and could be confused with Respondent Hung Up During Intro
Refusals
A combined count of respondents who declined participation, covering four specific disposition codes:
- RHU -- Respondent Hung Up during the introduction or screener text. *These are a gray area, and could be confused with Dialer Sent No One
- SRF -- Soft Refusal (respondent declined but may be re-contacted).
- HRF -- Hard Refusal (respondent declined and should not be re-contacted).
- DNC -- Do Not Call (respondent requested to be added to the internal DNS/suppression list).
Resolved
The total count of numbers that have reached a final, non-productive outcome -- meaning the number is effectively dead and will not be redialed. This includes any disposition where no further contact attempt would be made, such as: Completes, Terms, Over Quotas, disconnected numbers, language barriers, fax/computer tones, wrong numbers, and similar unworkable results.
Complete
The number of interviews that were fully completed by a respondent who qualified and finished the entire survey.
Terms
Respondents who were screened out (terminated) during the interview because they did not qualify for the study based on the screener criteria.
Over Quota (OQ)
Respondents who qualified and would have completed the interview, but were terminated because the quota cell they fell into was already full at the time of their call.
Incidence
A calculated percentage representing the rate at which willing respondents qualify and complete the survey. The formula is:
Incidence = Completes / (Completes + Terms + Over Quotas)
A higher incidence percentage means a larger share of respondents who engage with the survey are making it through to a complete. A lower incidence typically indicates heavy screening requirements or a difficult-to-reach target population.
Usage Notes
- This dashboard is intended for monitoring active dialing sessions. It is not a replacement for end-of-day or end-of-project reporting.
- Because the data refreshes every 15 seconds, numbers will shift during active calling hours -- especially in the Current Hour columns.
- The Last Hour columns provide a stable recent snapshot and can be useful for spotting trends or sudden changes in call patterns.
- If a project does not appear on the dashboard, confirm with programming staff that the project is actively loaded and dialing.
Dashboard Overview - INTV Realtime Report
Overview
The Interviewer Dashboard (INTVDash) is a real-time monitoring tool that displays live calling activity broken down by interviewer, for every active project currently running on the phone room floor. It is accessible to anyone on the internal network and requires no login.
INTVDash is located in the Maxwell Portal, under PhoneOps Dashboard in the left-hand navigation menu.
How It Works
The dashboard automatically refreshes every 15 seconds and is active daily from 9:00 AM to 2:00 AM. When multiple projects are running simultaneously, each project appears as its own table on the same page, stacked vertically. A last update timestamp is displayed at the top of the page, reflecting the most recent data received from the system.
If you need to pause and review the numbers more closely, a Pause Refresh drop-down is available at the top of the page. Clicking it stops the auto-refresh until you resume it.
Reading the Dashboard
Each project table is labeled with its Job Name and contains one row per interviewer currently or recently assigned to that project. The first row is always a Shift Total, which provides a rolled-up summary across all interviewers for that project.
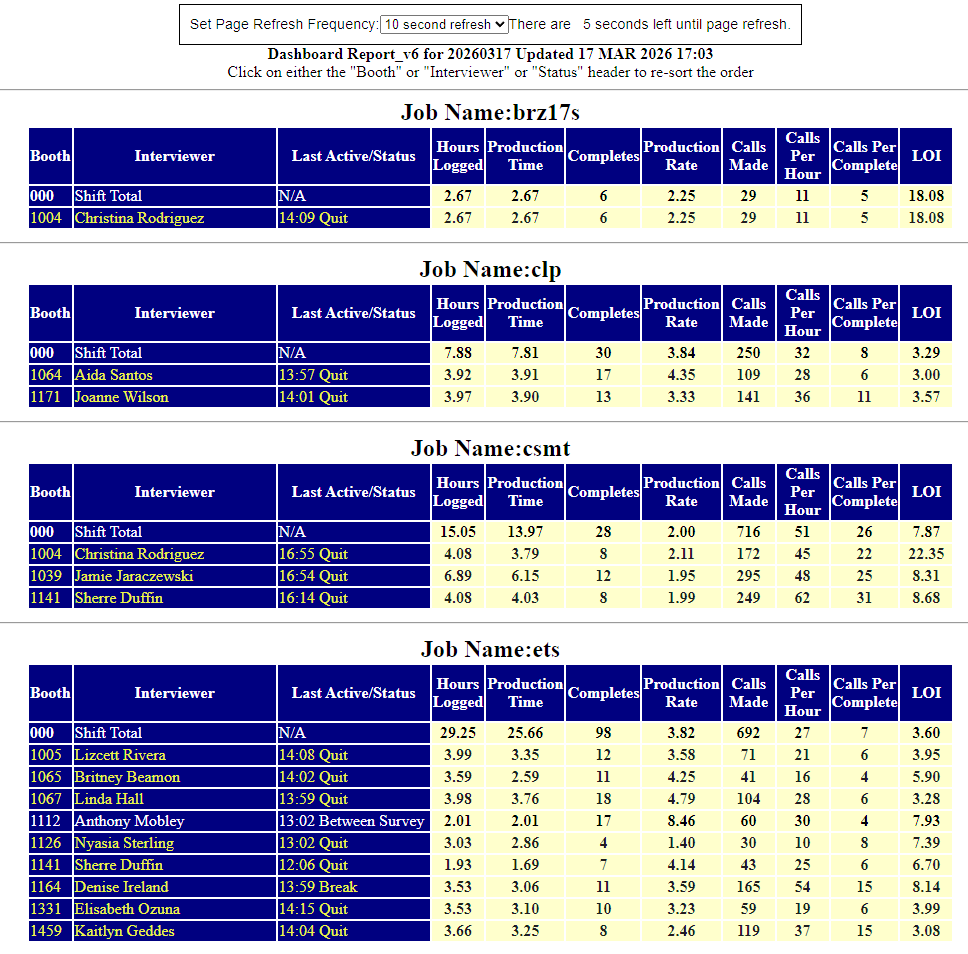
Column Definitions
| Column | Description |
|---|---|
| Booth | The interviewer's assigned booth number in the system. |
| Interviewer | The interviewer's name. |
| Last Active / Status | A timestamp and status code reflecting the last update received from that interviewer. See Status Codes below. |
| Hours Logged | Total hours the interviewer has been logged into the system during the current shift. |
| Production Time | Time spent actively in productive calling (excludes breaks, meetings, etc.). |
| Completes | Number of completed surveys recorded for this interviewer on this project. |
| Production Rate | Completes per production hour. |
| Calls Made | Total number of outbound calls placed by this interviewer. |
| Calls Per Hour | Average calls placed per production hour. |
| Calls Per Complete | Average number of calls required to achieve one complete. |
| LOI | Length of Interview -- the average duration (in minutes) of completed surveys for this interviewer. |
Viewing Historical Reports
At the bottom of every INTVDash page, two navigation links are available:

- Yesterday's Report (yyyymmdd) -- Loads the report for the previous day. The date is shown in the link label so you always know which day you are navigating to.
- Back to Most Current Report -- Returns you to today's live, auto-refreshing dashboard.
Historical data is available going back weeks to months. If you want to jump directly to a specific date rather than clicking through day by day, you can manually enter the date into the browser's address bar using the following format:
/dashboard_report_20260315.html
Replace 20260315 with the date you want to view in YYYYMMDD format.
Row Color Coding
A dash ( - ) in any numeric column indicates a zero or null value -- no data recorded for that interviewer in that category yet.
- White row -- Interviewer is currently logged in and active on the project.
- Yellow row -- Interviewer has logged out.
Status Codes
The Last Active / Status column displays the time of the last system update alongside one of the following status codes:
| Status | Meaning |
|---|---|
| Dialing | Interviewer is actively dialing outbound calls. |
| Screening | Interviewer is on a call and going through the screener portion of the survey. |
| In Interview | Interviewer is actively conducting a survey interview. |
| Wrap Up | Interviewer has finished a call and is completing any post-call wrap-up steps before dialing again. |
| Between Survey | Interviewer is between calls, waiting to be connected to the next dial attempt. |
| Quit | Interviewer has exited the project. Row will appear yellow. |
| Unknown Status | Typically happens when an interviewer logs in, and immediate back out. The dashboard looks for information sent via the survey script, to fill the status. If they never load a survey, Unknown Status will be shown. |
| Meeting | Interviewer is in a meeting and temporarily away from dialing. |
| Lunch | Interviewer is on a lunch break. |
| Break | Interviewer is on a short break. |
Dashboard Overview - Production Report
Realtime Production Report
The Realtime Production Report is the primary supervisory tool for monitoring project and interviewer performance during an active calling shift. It is the digital equivalent of walking the floor every hour to check on each interviewer's production -- except it updates automatically every 5 minutes.
The report runs daily from 9:00 AM to 2:00 AM and auto-refreshes every 310 seconds (5 minutes plus a 10-second buffer to allow for compile time) from the moment the page is first loaded.
This report is available to all Portal users.
Accessing the Report
The Realtime Production Report can be accessed two ways:
- Directly via browser URL
- Through the MAXWell Portal dashboard link
Page Layout Overview
The report is organized into two levels: an Overall Summary at the top of the page, followed by individual Per-Project Tables for each active study.
Overall Summary Table
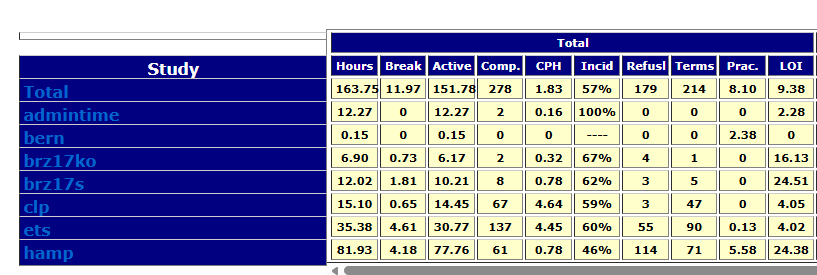
The top table displays a rolled-up view of all active projects combined, with one row per study plus a grand Total row. This gives supervisors an at-a-glance picture of how the entire shift is performing.
The Overall Summary shows every hour of the day across its hourly columns -- one column group per hour, from the start of the shift through the current time.
Clicking on a Project's name will jump you down to that project's agent specific table.
Per-Project Tables
Below the summary, each active project has its own table. These tables break down production to the individual interviewer level.
Within each project table, there are three category rows before the individual agent listings:
- Total -- Combined stats for all agents on the project (active and inactive)
- Active* -- Agents currently connected to this project
- Inactive -- Agents who have either switched to a different project or ended their shift for the day
Individual agent rows follow, sorted alphabetically by last name (displayed as Last, First). Each agent row is prefixed with the station number they logged into, enclosed in parentheses -- for example: (1116*) Reyes Andrew.
An asterisk (*) next to the station number indicates the agent is currently connected to the project.
On larger projects, the column header row will repeat after every 15th agent to make scrolling through long tables easier.
Project tables remain on the page for the full shift even after all agents on that project go inactive. The table will stop adding hourly columns at the last hour the project saw activity.
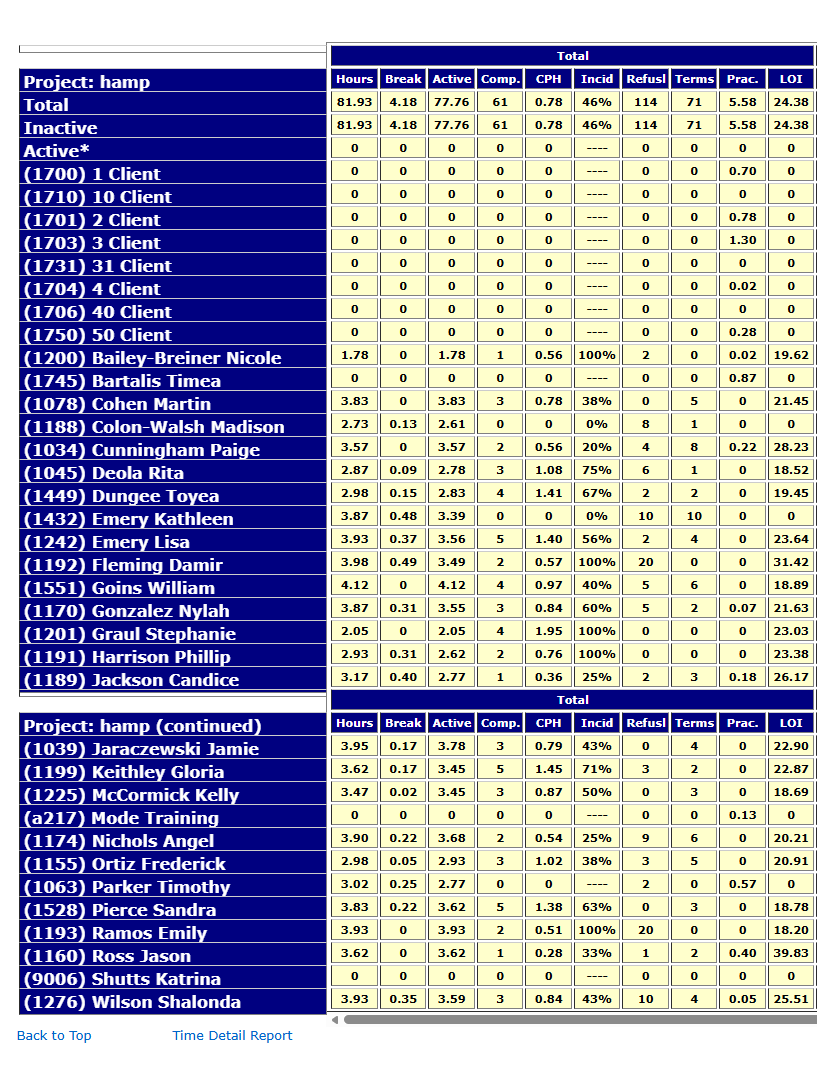
Column Definitions
Each table contains a Total column group (cumulative for the full day) followed by individual hourly column groups -- one per hour the project was active. Both the Total and hourly groups share the same columns, with one exception noted below.
Hourly columns are arranged with the most recent hour on the left, scrolling right into earlier hours. This ensures the most current data is always visible when the page loads without scrolling.
Cells displaying ---- indicate there is no data available to calculate that value for that period.
| Column | Description | Total | Hourly |
|---|---|---|---|
| Hours | Total hours logged. Includes both active time and break time. | Yes | Yes |
| Break | Time logged as Break, Lunch, or Meeting. | Yes | Yes |
| Active | Actual working time. Calculated as Hours minus Break. | Yes | Yes |
| Comp. | Number of completed surveys. | Yes | Yes |
| CPH | Completes Per Hour. Based on active (working) hours, not total hours logged. | Yes | Yes |
| Incid | Incidence rate. The percentage of contacts that resulted in a complete, calculated as: Completes / (Completes + Terminates + Over Quota). | Yes | Yes |
| Refusl | Total refusals of all types -- Soft Refusal, Hard Refusal, RHU (Refusal Hang-Up), and DNC (Do Not Call). | Yes | Yes |
| Terms | Survey terminates -- respondents who qualified to start the survey but did not complete it. | Yes | Yes |
| Prac. | Practice minutes logged. Reflects time an interviewer spent in practice/training mode. | Yes | Yes |
| LOI | Average Length of Interview, in minutes. Based on completed surveys only. Measures true survey time from introduction to last question -- does not include dialing or wrap-up time. Total section only -- not shown in the hourly columns. | Yes | No |
Navigating Wide Tables
Because each project table grows a new column group for every active hour, tables can become quite wide -- especially later in the shift. A horizontal scrollbar appears beneath each table, allowing you to scroll right to view earlier hours. The most recent hour is always visible on the left without scrolling.
Day Shift / Night Shift Breakdown
On weekdays after 5:00 PM, the report will automatically add two additional subtotal column sections to the overall summary table (not the individual per-project tables):
- Day Shift -- Production from 9:00 AM through 4:59 PM
- Night Shift -- Production from 5:00 PM onward
This is useful for comparing how each shift performed independently, without needing to manually separate the numbers.

Historical Navigation
Below the overall summary table, the page provides links to browse to previous or next day reports:
- Yesterday's Report -- navigates one day back
- Next Day Report -- navigates one day forward (when available)
- Return to the most current report -- jumps back to today
Previous day reports can also be accessed directly via URL. The format is:
report_YYYYMMDD_v2.html
For example, to view the report for March 17, 2026, you would navigate to:
report_20260317_v2.html
Time Detail Report
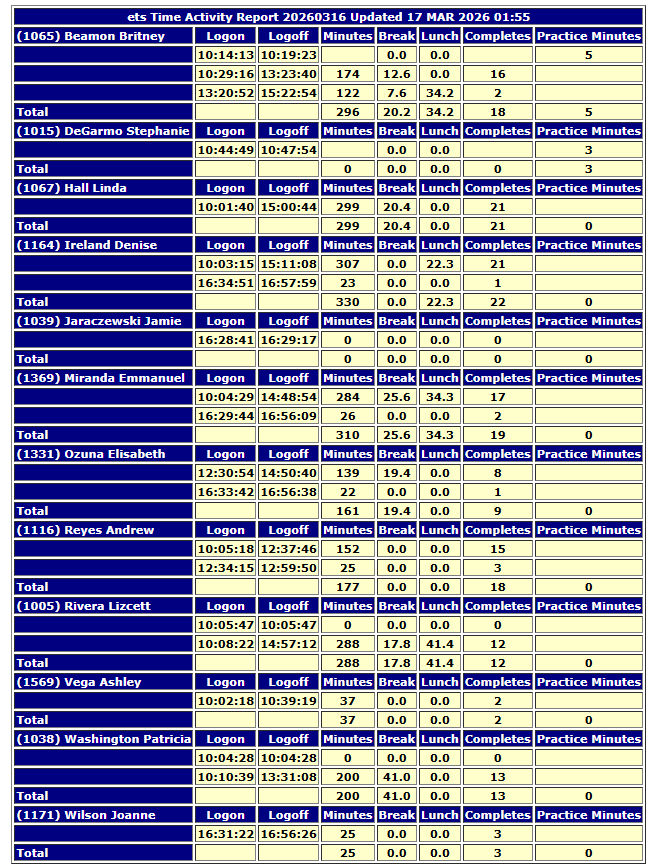
At the bottom of each per-project table is a link labeled Time Detail Report. Clicking this opens a new browser window showing a detailed punch card view for every agent on that project.
Each agent's Time Detail section includes:
- Login time
- Logout time
- Total minutes logged
- Break/Lunch minutes
- Completes during that session
- Any practice time during the login/logout window
- A total row summarizing all sessions for that agent
All login/logout sessions for a single agent are grouped together in succession, followed by a total row for that agent, before moving on to the next agent. The report is not sorted by time across all agents -- it is organized agent by agent.
Known Behaviors and Quirks
Station Number vs. Agent ID
The number shown in parentheses before an agent's name is their station number -- the workstation or dial position they logged into -- not their agent ID number. While agents are generally expected to log into their assigned station, exceptions can occur due to file locks or login errors.
This is important to keep in mind if you use the browser's Find (Ctrl+F) to search for a specific agent ID and do not get a match. The report displays station numbers, not agent IDs.
Hour-Boundary Carry-Over
Because of how the report compiles session data, an agent who is mid-survey at the top of an hour may have their time split across two hourly buckets. For example, a session that starts at 1:51 PM and ends at 2:04 PM may show 49 minutes in the 1:00 PM column and 11 minutes in the 2:00 PM column. This can cause hourly CPH figures to appear slightly off.
This is expected behavior. The overall totals will balance correctly by end of shift.
Agent Sort Order
Agents are sorted alphabetically by last name and displayed in Last, First format.
Troubleshooting and Tips
A project is not showing up on the report
If a project just went active, it may not appear yet. The report compiles on a 5-minute cycle -- wait for the next refresh and check again.
The report shows no projects, or is showing old projects from a previous day
The shift has likely not started yet. The report does not clear until the new day's shift begins at 9:00 AM. Before that time, the previous day's report will still be displayed.
A note on LOI accuracy
The LOI (Length of Interview) value shown on the report is an average of averages, not a true weighted average. Each agent's average LOI is calculated individually, and those averages are then averaged together at the project level. This means the report LOI will typically be within 1-2 minutes of the true LOI, but will not exactly match the figures in nightly production reports.
Example:
Suppose two agents complete surveys:
- Agent A completes 10 surveys averaging 8 minutes each
- Agent B completes 2 surveys averaging 14 minutes each
True average: (10 x 8) + (2 x 14) = 80 + 28 = 108 total minutes / 12 surveys = 9.0 minutes
Average of averages (what the report shows): (8 + 14) / 2 = 11.0 minutes
The difference is most noticeable when agents have significantly different survey volumes. For general monitoring purposes during a shift, the report LOI is a useful reference -- just don't use it as the authoritative figure for deliverables or client reporting.
How To: Caller ID/LCP Settings & Call Interceptor Program
CallerIDs/LCP & Call Interceptor System:
A How To Guide for PDs
The Realtime CallerID Adjustment System is the single, authoritative source for managing the outbound CallerID numbers used on your studies -- no more dropping or relaunching a job just to update the number list, and no separate Survox or MAXWell setup steps required.
When active on a study, this system controls the CallerID used on outbound calls in real time. Changes made here take effect on the very next call -- instantly, with no reload required.
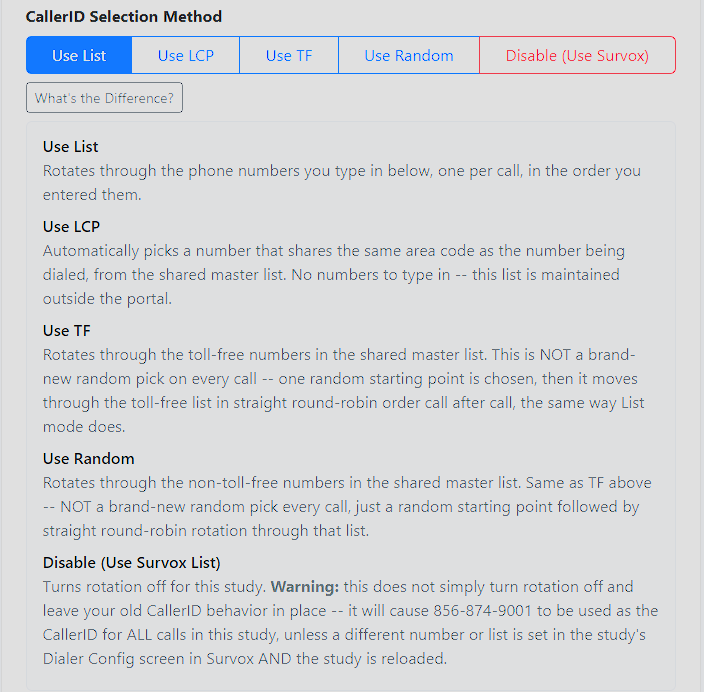
Five modes are available per study, switchable any time:
- Use List -- Rotates through the phone numbers you type in below, one per call, in the order you entered them.
- Use LCP -- Automatically picks a number that shares the same area code as the number being dialed, from the shared master list. No numbers to type in -- this list is maintained outside the portal.
- Use TF -- Rotates through the toll-free numbers in the shared master list. This is NOT a brand-new random pick on every call -- one random starting point is chosen, then it moves through the toll-free list in straight round-robin order call after call, the same way List mode does.
- Use Random -- Rotates through the non-toll-free numbers in the shared master list. Same as TF above -- NOT a brand-new random pick every call, just a random starting point followed by straight round-robin rotation through that list.
- Disable (Use Survox List) -- Turns rotation off for this study. Warning: this does not simply turn rotation off and leave your old CallerID behavior in place -- it will cause 856-874-9001 to be used as the CallerID for ALL calls in this study, unless a different number or list is set in the study's Dialer Config screen in Survox AND the study is reloaded.
Note: If a job does not exist yet in the Realtime CallerID Adjustment System, it will automatically be created once a call is dialed on it, and defaulted to LCP mode until it is set up with a different mode.
Switching between modes preserves your existing list in the background, so you can flip back and forth without losing your work.
Using the Realtime CallerID Adjustment System
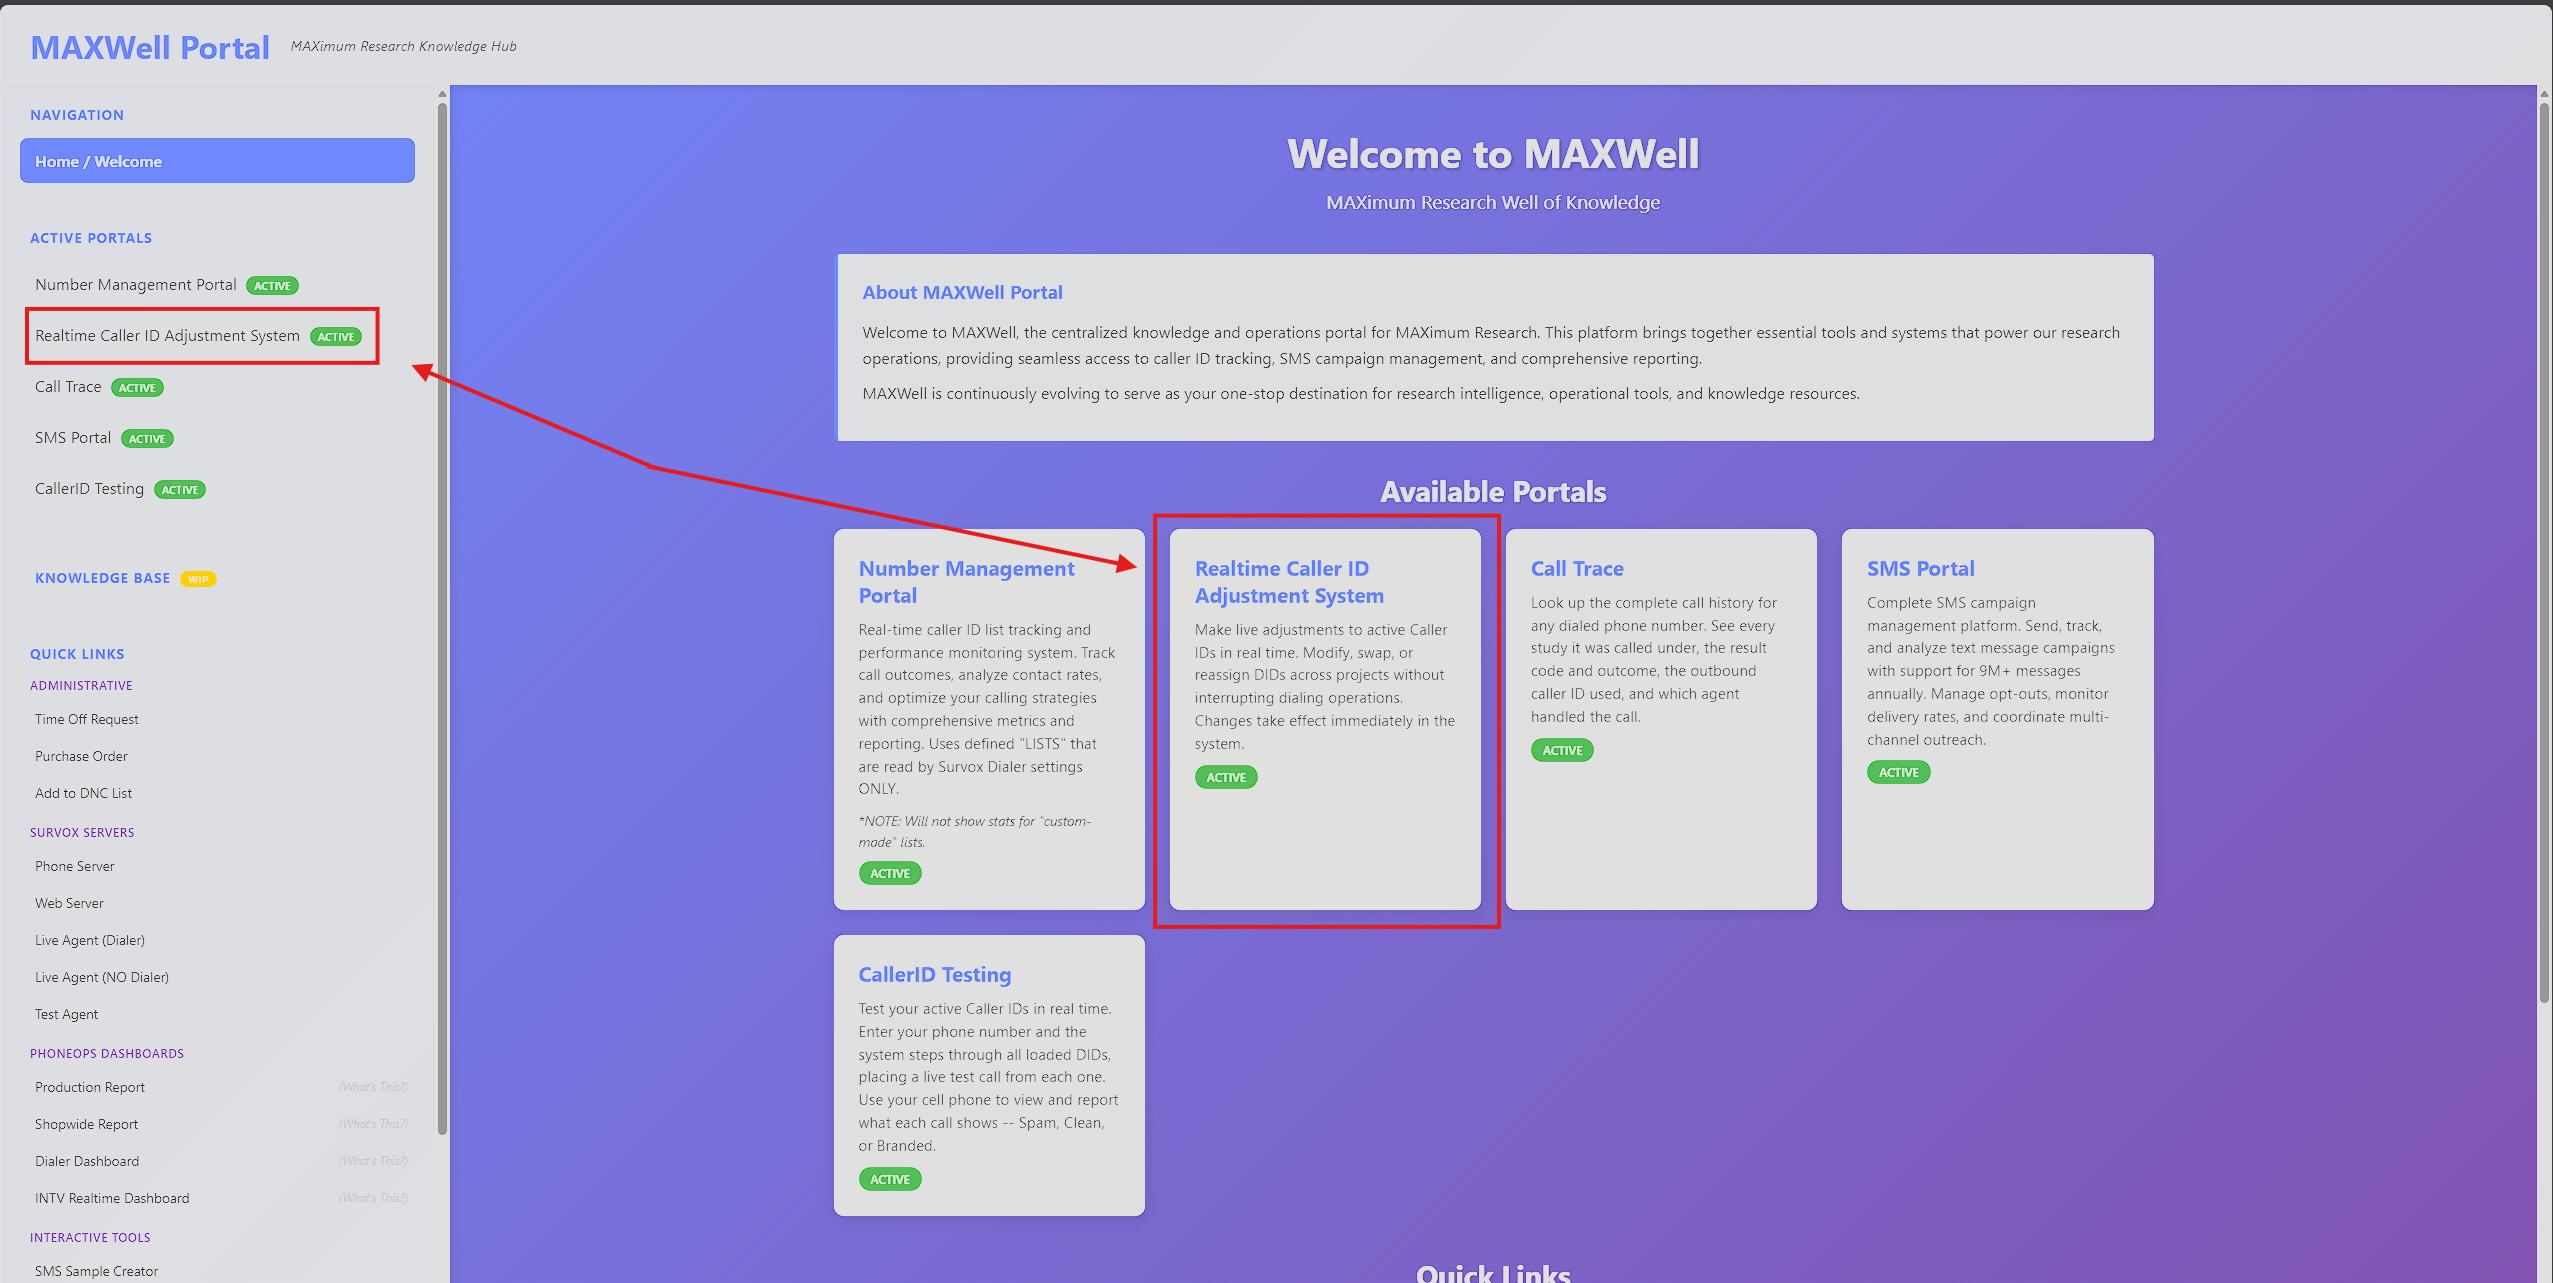
In MAXWell, click on the "Realtime CallerID Adjustment System" menu/box.
Create New Job / Edit Existing Job
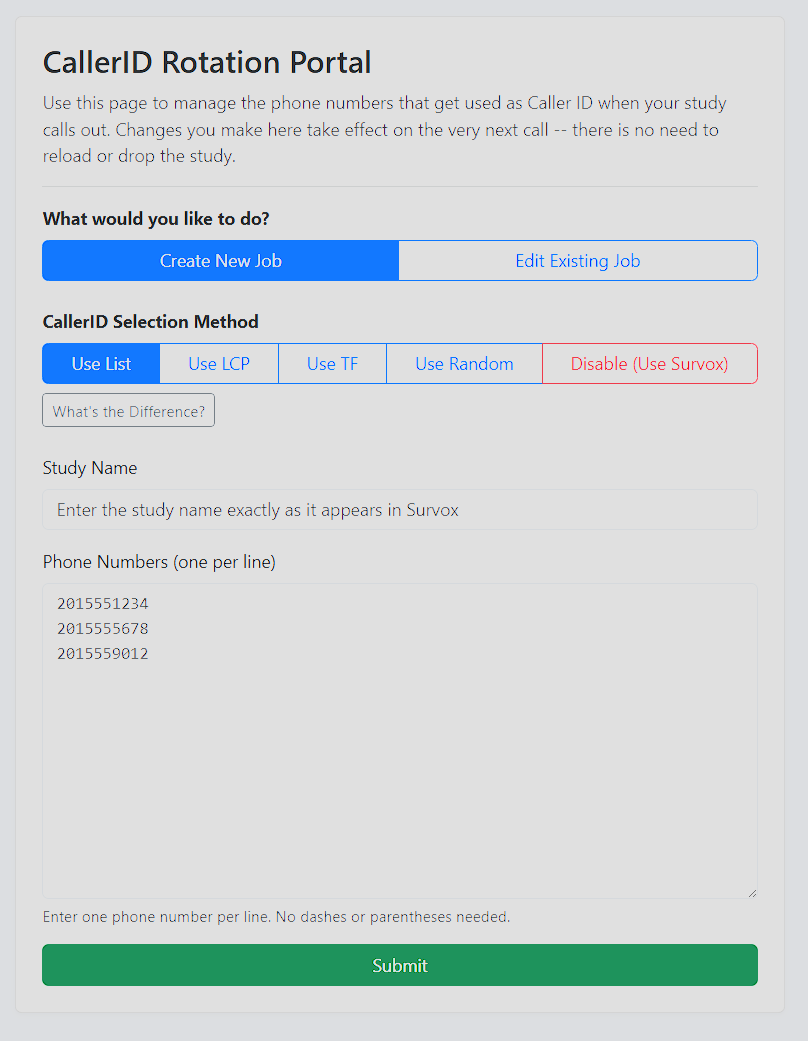
Self-explanatory -- choose whichever applies to your situation. If your job does not exist yet in the system, it will be created automatically once a call is dialed on it, and defaulted to LCP mode until you set it up with a different mode.
Mode Selection
Choose the mode for the study: Use List, Use LCP, Use TF, Use Random, or Disable. See the mode descriptions above for details on each.
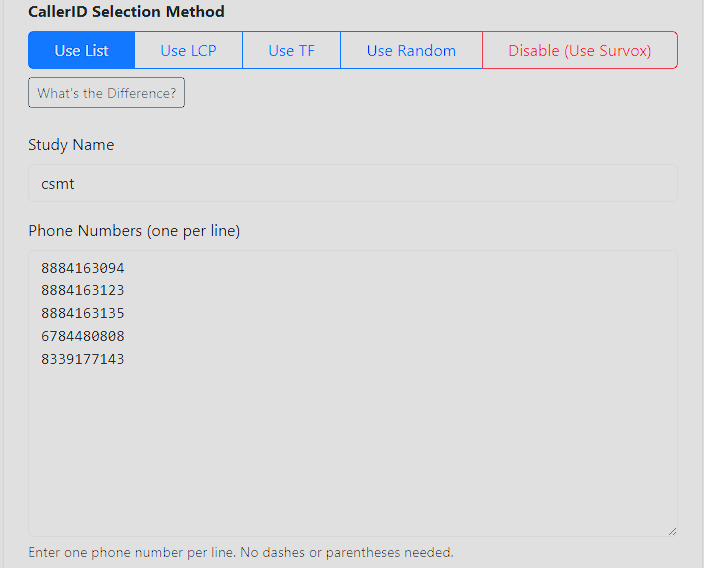
Study Name
This field MUST match the Survox study name letter for letter. Case does not matter.
If the Study Name does not match exactly, the system won't recognize it as the same job. Since the Interceptor auto-creates a job the moment a call is dialed, a mismatch results in TWO jobs existing for the same study -- the one you manually created, and a separate auto-generated one (defaulted to LCP) under the name Survox is actually sending. For example, if you create a job called "oh_state" but the Survox study name is actually "ohstate," you will end up with two separate jobs listed: your "oh_state" job, and an auto-generated "ohstate" job.
Phone Numbers
Paste in the actual numbers you want to use, one per row. This field is only valid if using "Use List" mode.
When you are happy with your selections, click the green "Submit" button at the bottom. Your new Interceptor task will be created and active immediately.
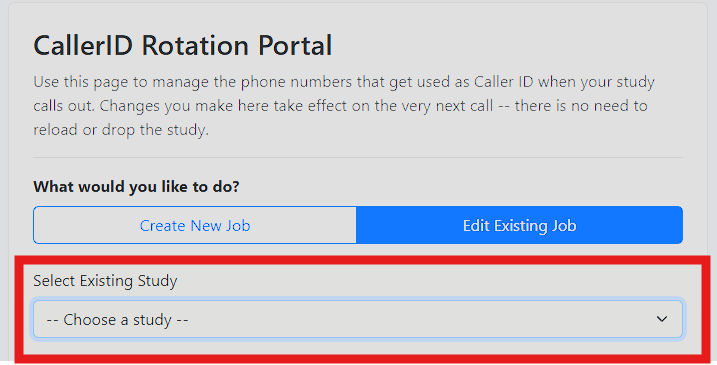
Edit Existing Job
The only real difference here is that the Study Name type-in box becomes a dropdown, letting you select an existing project. All other steps and notes covered above are the same.
There are 2 additional options available when editing an existing job:
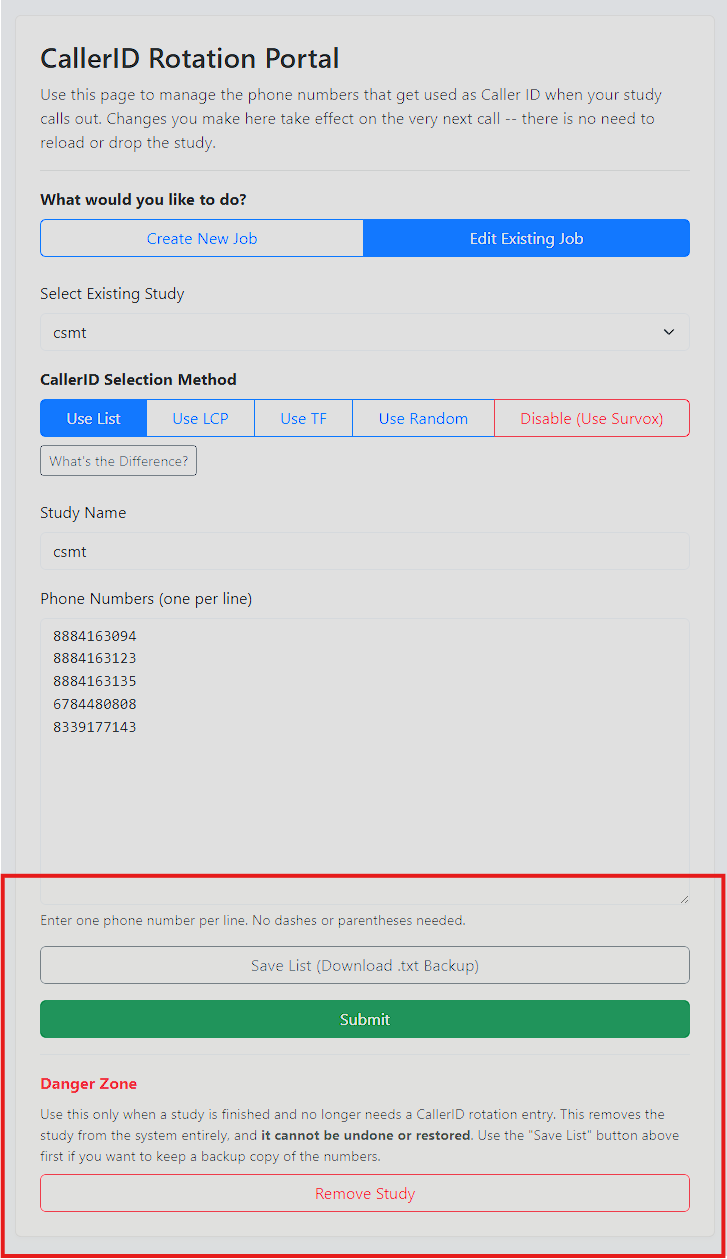
If you plan to remove a study, it's recommended to use Download List right beforehand to save a record of the settings -- though this is completely optional.
- Download List -- Creates a txt file for you to save when a project is done, so you can store the settings for later reference, should the job come back, or if someone asks how it was set up.
- Remove Study -- Completely DELETES the project from the Interceptor program. This should ONLY be done after a project has concluded fielding and is billed. Doing so helps keep the database at a minimum and running smoothly. Note: If a study is removed prematurely, the system will only recreate the job (defaulting it back to LCP mode) once a call is actually dialed on it afterward.
Notes
- Numbers and Mode changes are INSTANT, starting with the very next call.
- All changes are logged and stored for historic reference (Brian access needed to view logs).
- Adding a number into a list multiple times "weights" it, so it gets used more frequently.
Verifying Your Changes
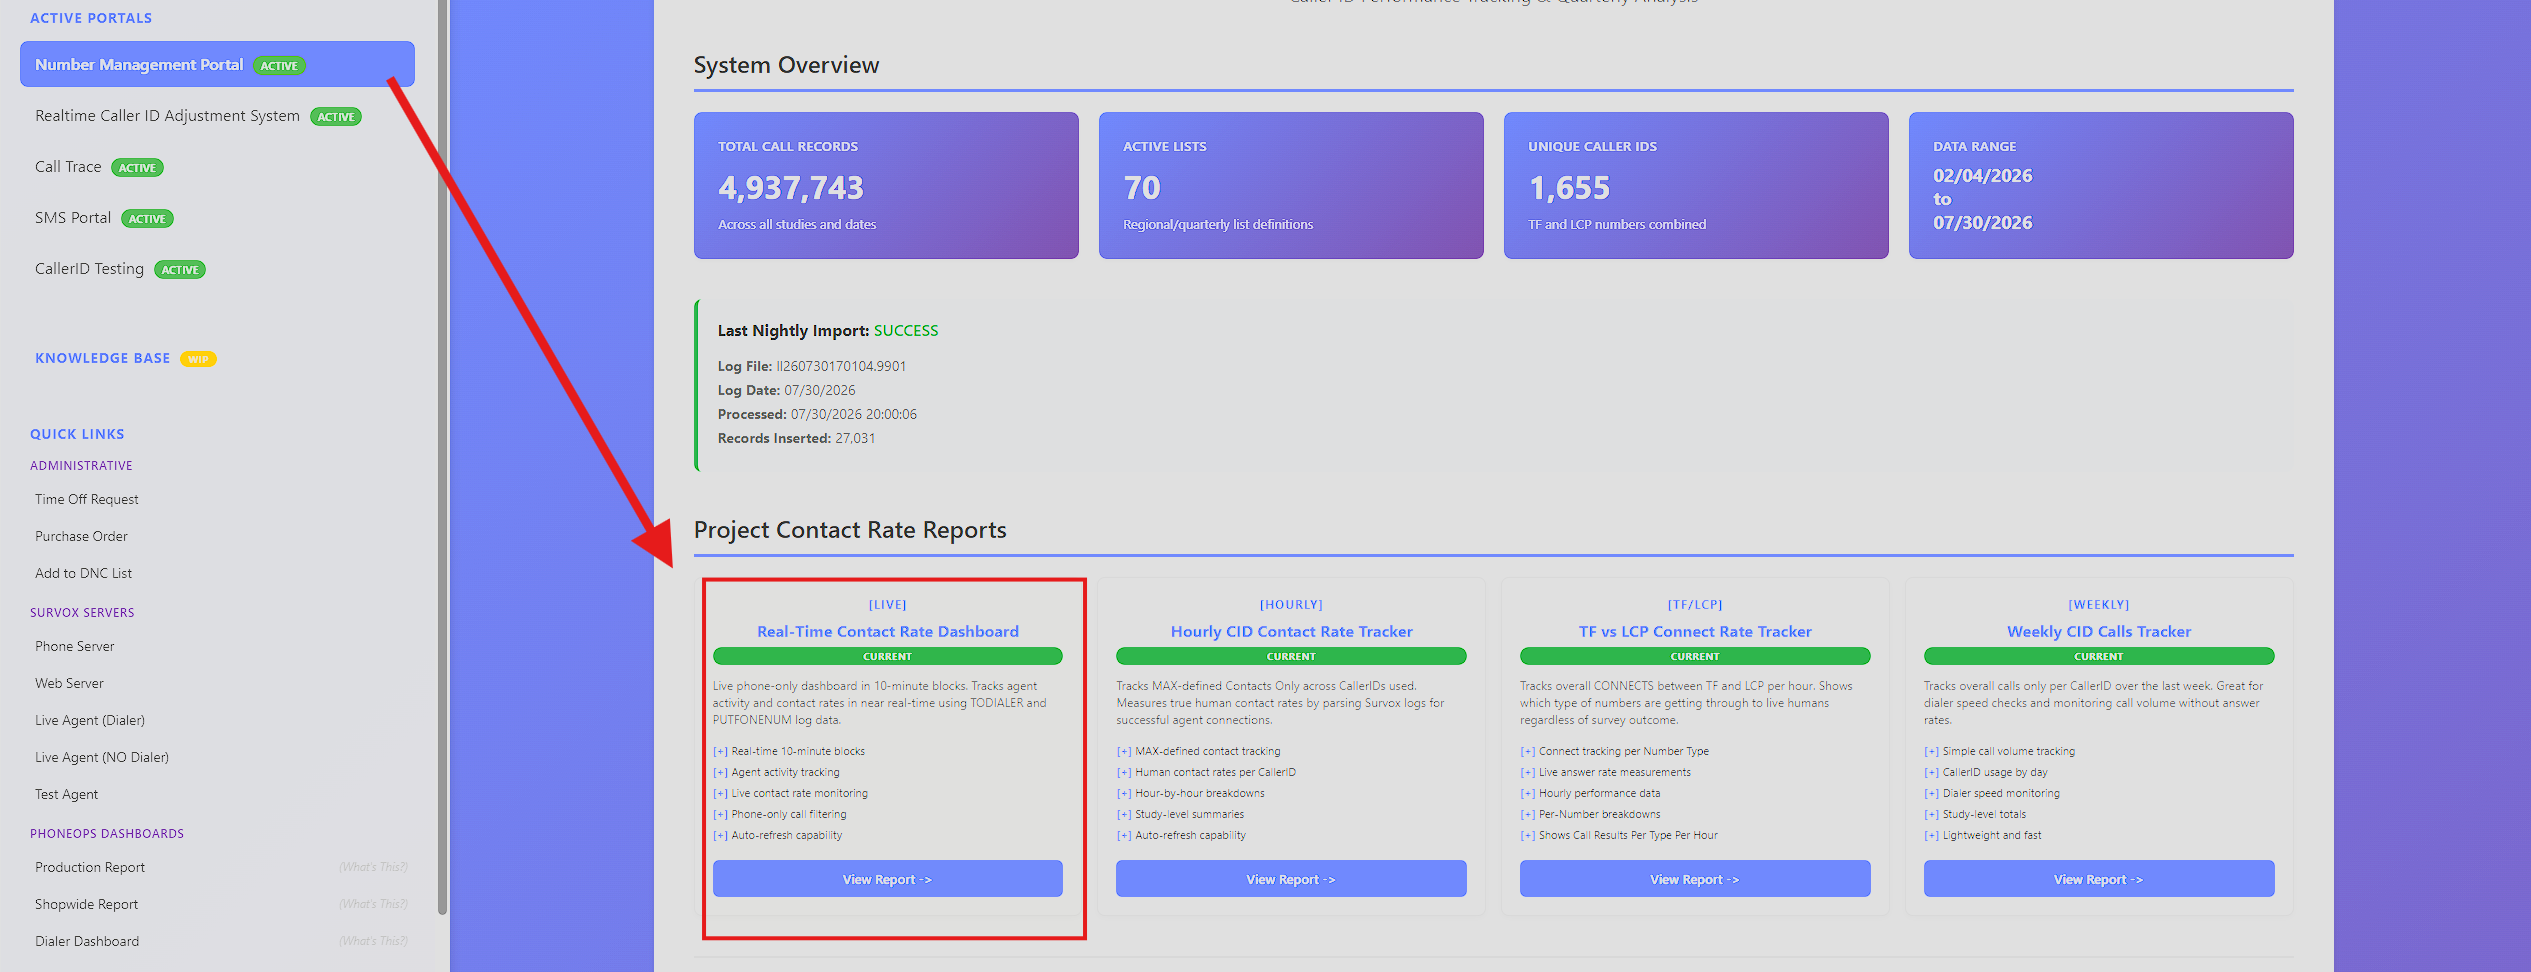
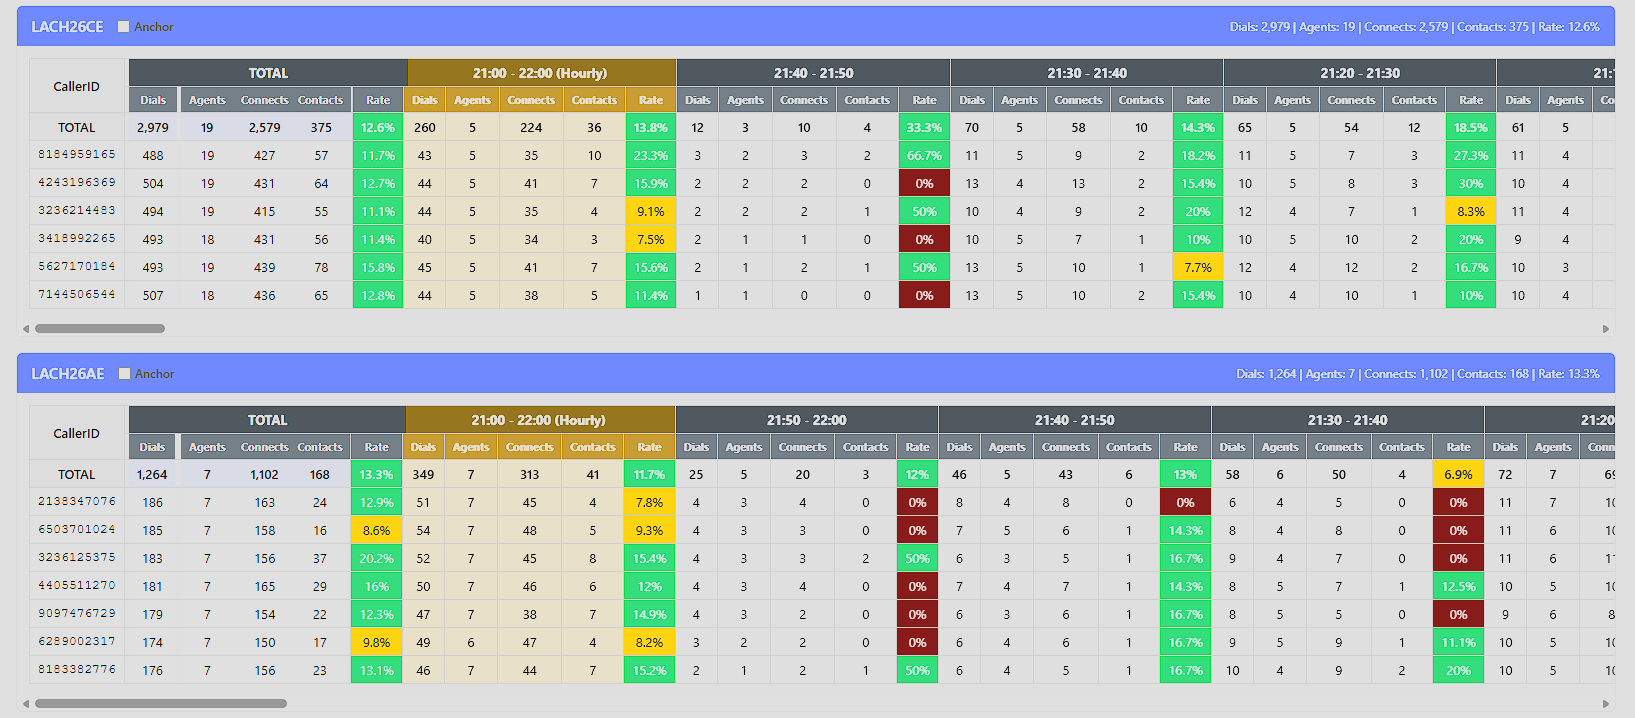
To check your changes are working, you can view the Realtime Dashboard from MAXWell's Number Management Portal. You should see the changes reflected within a few minutes.
- If you switched modes or added new numbers to a List, you should start seeing new numbers appear with calls from them in the table for the study.
- If you removed a number from a List, or switched away from a mode, the numbers no longer in use should stop incrementing shortly (calls still live from before the change can still cause minor increases).
Common Problems Q&A
Q: I created a job, but the calls are still using the wrong CallerIDs. What happened?
A: This is almost always a Study Name mismatch. Since the system auto-creates a job the moment a call is dialed, a mismatch results in TWO jobs existing for the study -- the one you manually created, and a separate auto-generated one (defaulted to LCP) under the name Survox is actually sending. Double check the dropdown/job list for a similarly-named duplicate job.
Q: What actually happens if I use Disable mode?
A: All calls on that study will use 856-874-9001 as the CallerID -- this is not the same as "leaving CallerID behavior alone." This should be avoided in almost all cases. If you do need to use it intentionally, a list must also be set in the study's Dialer Config screen in Survox, AND the study must be reloaded, or every call will go out on 856-874-9001.
Q: What's the difference between Use TF and Use Random?
A: Use TF rotates through the toll-free numbers in the shared master list; Use Random rotates through the non-toll-free numbers in that same list. Neither one picks a brand-new random number on every call -- each picks one random starting point, then moves through its list in straight round-robin order from there, the same way List mode does. Note: switching modes resets the last number used, so if you switch back to either of these modes later, it could start at a different spot in the list.
Q: When should I use Remove Study?
A: Only after a project has finished fielding and has been billed. It's a good idea to use Download List first to save a copy of the settings before removing. If a study is removed prematurely, the system will simply recreate the job (defaulted back to LCP mode) the next time a call is actually dialed on it.
Q: When should I create my Study?
A: Unlike survox, you can make these projects at anytime, as long as you know what the programmer is using as the studycode.